NEWS - Check out our press
release
For a detailed description with references please
read our manuscript
Reference:
Adamkovics, M., I. de Pater, H. Roe, S. Gibbard, and
C. Griffith, 2004. Spatially-resolved spectroscopy at 1.6 micron of
Titan's atmosphere and surface. Geophys. Res. Lett. 31, L17S05, doi:10.1029/2004GL019929.
The vertical structure of Titan's atmosphere and
surface composition
can be probed spectroscopically and usually involves integrating data
over the entire disk. Spatial variations in surface contrast, atmospheric
haze and clouds can be measured by
adaptive optics imaging
with narrowband filters. Below are results combining these two techniques.
With spatially-resolved spectroscopy the atmospheric structure and surface
albedo can be determined at various locations on the disk of Titan. These
data have been particularly useful in determining the magnitude and altitude
of the seasonal enhancement of tropopause haze near the Southern pole.
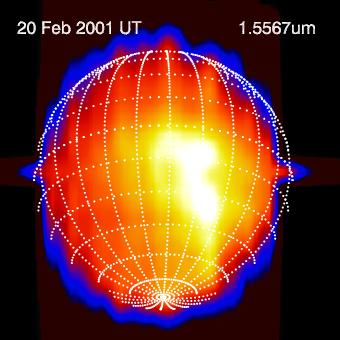
Below is a map of Titan at a wavelength that is sensitive to the surface,
constructed from NIRSPEC/AO
observations made on 20 February 2001 UT at W.M. Keck Observatory. Click on the
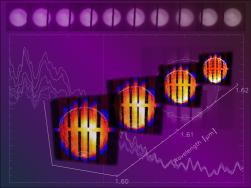
image to see a visualization of how the image of the disk changes as a function
of wavelength. Images from 1.5 - 1.7µm probe from the surface up to
above 150km in the atmosphere. Images at increasing wavelengths (particulary
in the 1.58 - 1.65µm range) are analagous to what would be seen travelling
up through the atmosphere from the surface, plowing through the tropopause,
and into the lower stratosphere -- which extends upwards to 500km. The movie
above shows a trip through Titan's lower atmosphere. Some things to look
for in the movie are the variations in albedo throughout regions that probe
the surface, then the striking change near 1.6µm, when the tropopause
(cirrus) haze in the Southern hemisphere dominates the contrast, and then
the stratospheric haze asymetries, which include the East-West limb brightenning
and the North-South haze asymetry.
Click on the image to see mpeg movie (3.3Mb)
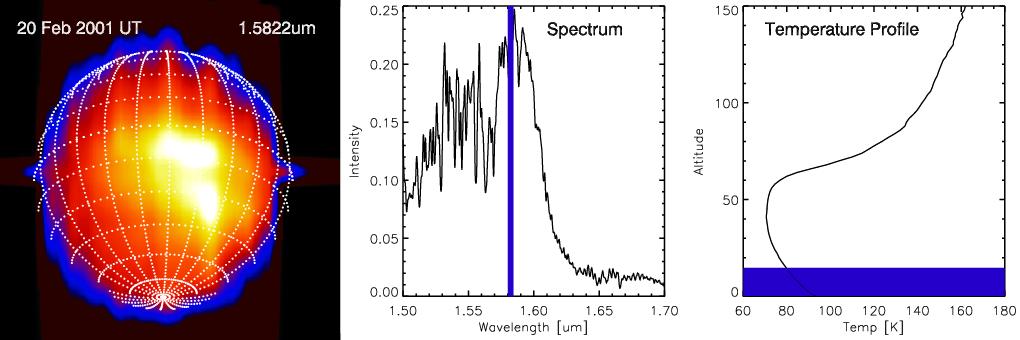
The figure below shows the same images reconstructed from individual spectra
as seen above (left), along with the spectrum at the center of the disk (center),
and the disk-integrated temperature profile (right). The vertical blue line
on the spectrum indicates the wavelength of the image seen at the left, and
the horizontal blue line on the temperature profile shows the altitude probed
that is probed.
Click on the image to see mpeg movie (3.3Mb)
This dataset allows for the direct quantitative measurement of the 3-dimensional
haze distribution from the surface to the stratosphere. Upcoming research
will involve writing the algorithms for efficient modelling of the data with
radiative transfer code -- as performed for selected points from this dataset
in our current manuscripts, for use in analysis of datasets that will be aquired
with field-integral spectrometers such as SPIFFI and OSIRIS.
This page is mirrored at: http://astron.berkeley.edu/~madamkov/titan
please bookmark this link
(last updated 04 April 14)