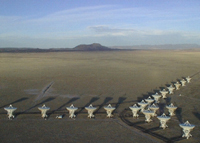

Karl G. Jansky Very Large Array (VLA)
Plains of San Augustin, west of Socorro, New Mexico
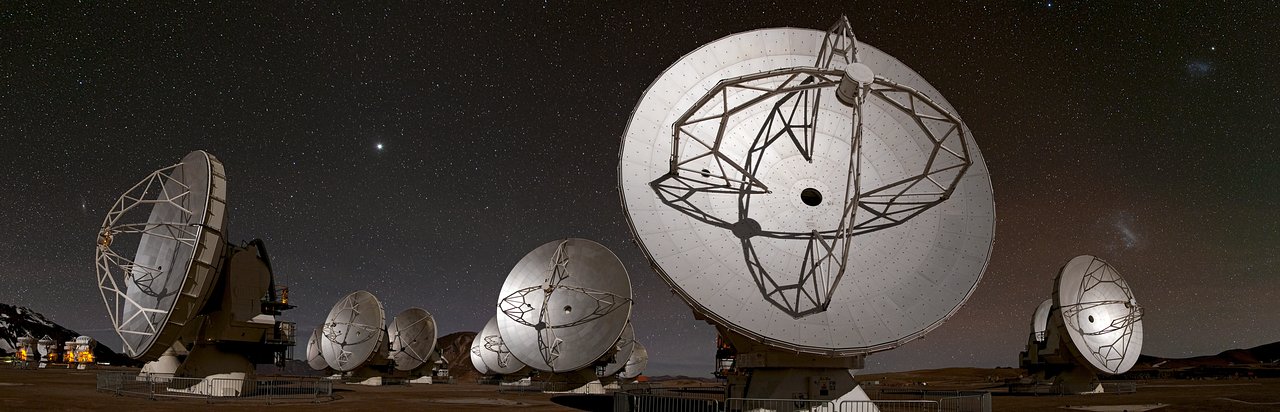
Atacama
Millimeter/submillimeter Array (ALMA)
Atacama Desert, Chile
Atacama Desert, Chile
|
|
|
|
|
Karl G. Jansky Very Large Array (VLA) Plains of San Augustin, west of Socorro, New Mexico |
Atacama
Millimeter/submillimeter Array (ALMA)
Atacama Desert, Chile |
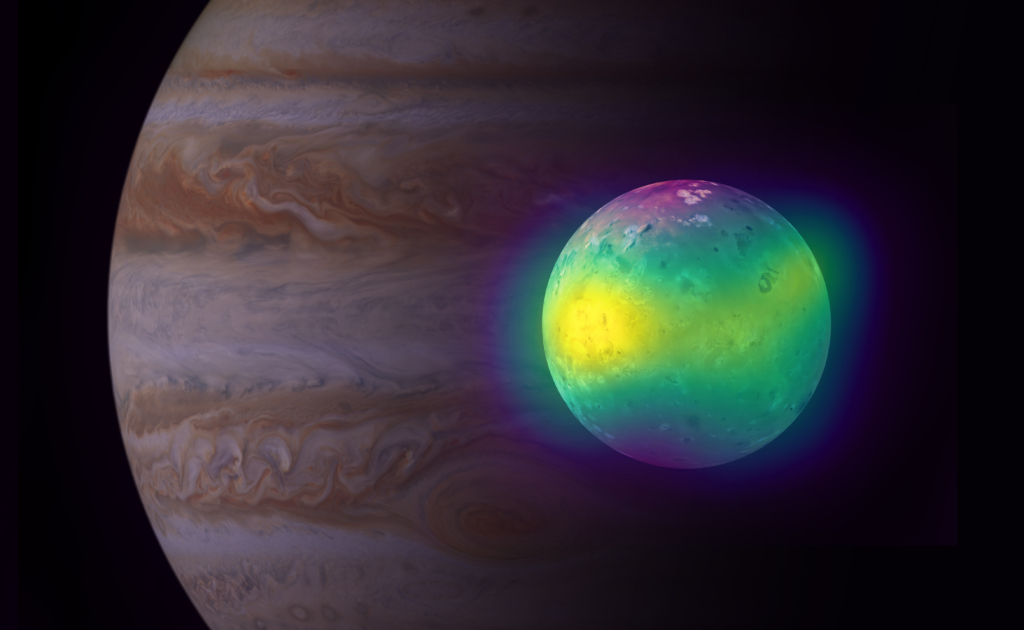
ALMA Observations of Io Going into and Coming out of Eclipse
We observed Jupiter's satellite Io with the Atacama Large (sub)Millimeter Array (ALMA) when the satellite entered Jupiter's shadow (eclipse) on 20 March 2018, and when it emerged from eclipse on 2 September 2018. Note that these were different eclipses, as Io's orbit around Jupiter is ~42 hrs, and an eclipse happens every orbit. Five different SO2 and 2 different SO transitions were observed, as well as one transition of KCl. There is clear evidence of volcanic plumes on March 20 and September 2. The plumes distort the line profiles, causing high-velocity (up to ~1 km/s) wings and red/blueshifted shoulders in the line profiles. During eclipse ingress, the SO2 flux density dropped exponentially, and the atmosphere re-formed in a linear fashion when re-emerging in sunlight, with a "post-eclipse brightening" after ~10 minutes. While both the in-eclipse decrease and in-sunlight increase in SO was more gradual than for SO2, the fact that SO decreased at all is evidence that self-reactions at the surface are important and fast, and that in-sunlight photolysis of SO2 is the dominant source of SO. Disk-integrated SO2 in-sunlight flux densities are ~2-3 times higher than in eclipse, indicative of a roughly 30%-50% contribution from volcanic sources to the atmosphere. The main change we see when Io enters an eclipse is that the fractional coverage of the gas is two to three times lower in eclipse than in sunlight, while the column densities and temperatures remain essentially the same. The low-level SO2 emissions that remain present during eclipse may be sourced by stealth volcanism (plumes without dust or condensates, so they are not visible by spacecraft in reflected sunlight), or be evidence of a layer of noncondensible gases preventing complete collapse of the SO2 atmosphere. Below we show several images; for line profiles and details see our paper:
de Pater, I., Luszcz-Cook, S., Rojo, P., Redwing, E., de Kleer, K., Moullet, A., 2020. ALMA observations of Io going into and coming out of Eclipse. Planetary Science Journal, vol. 1, nr.3, 60. DOI: 10.3847/PSJ/abb93d. ArXiv 2009.07729,
>>See Press Release UCB:2020/10/21<<
>>See Press Release NRAO:2020/10/21<<
Image and Movie from the Press releases:
-----------------------------------------
Image and Movies from the PSJ paper referenced above:
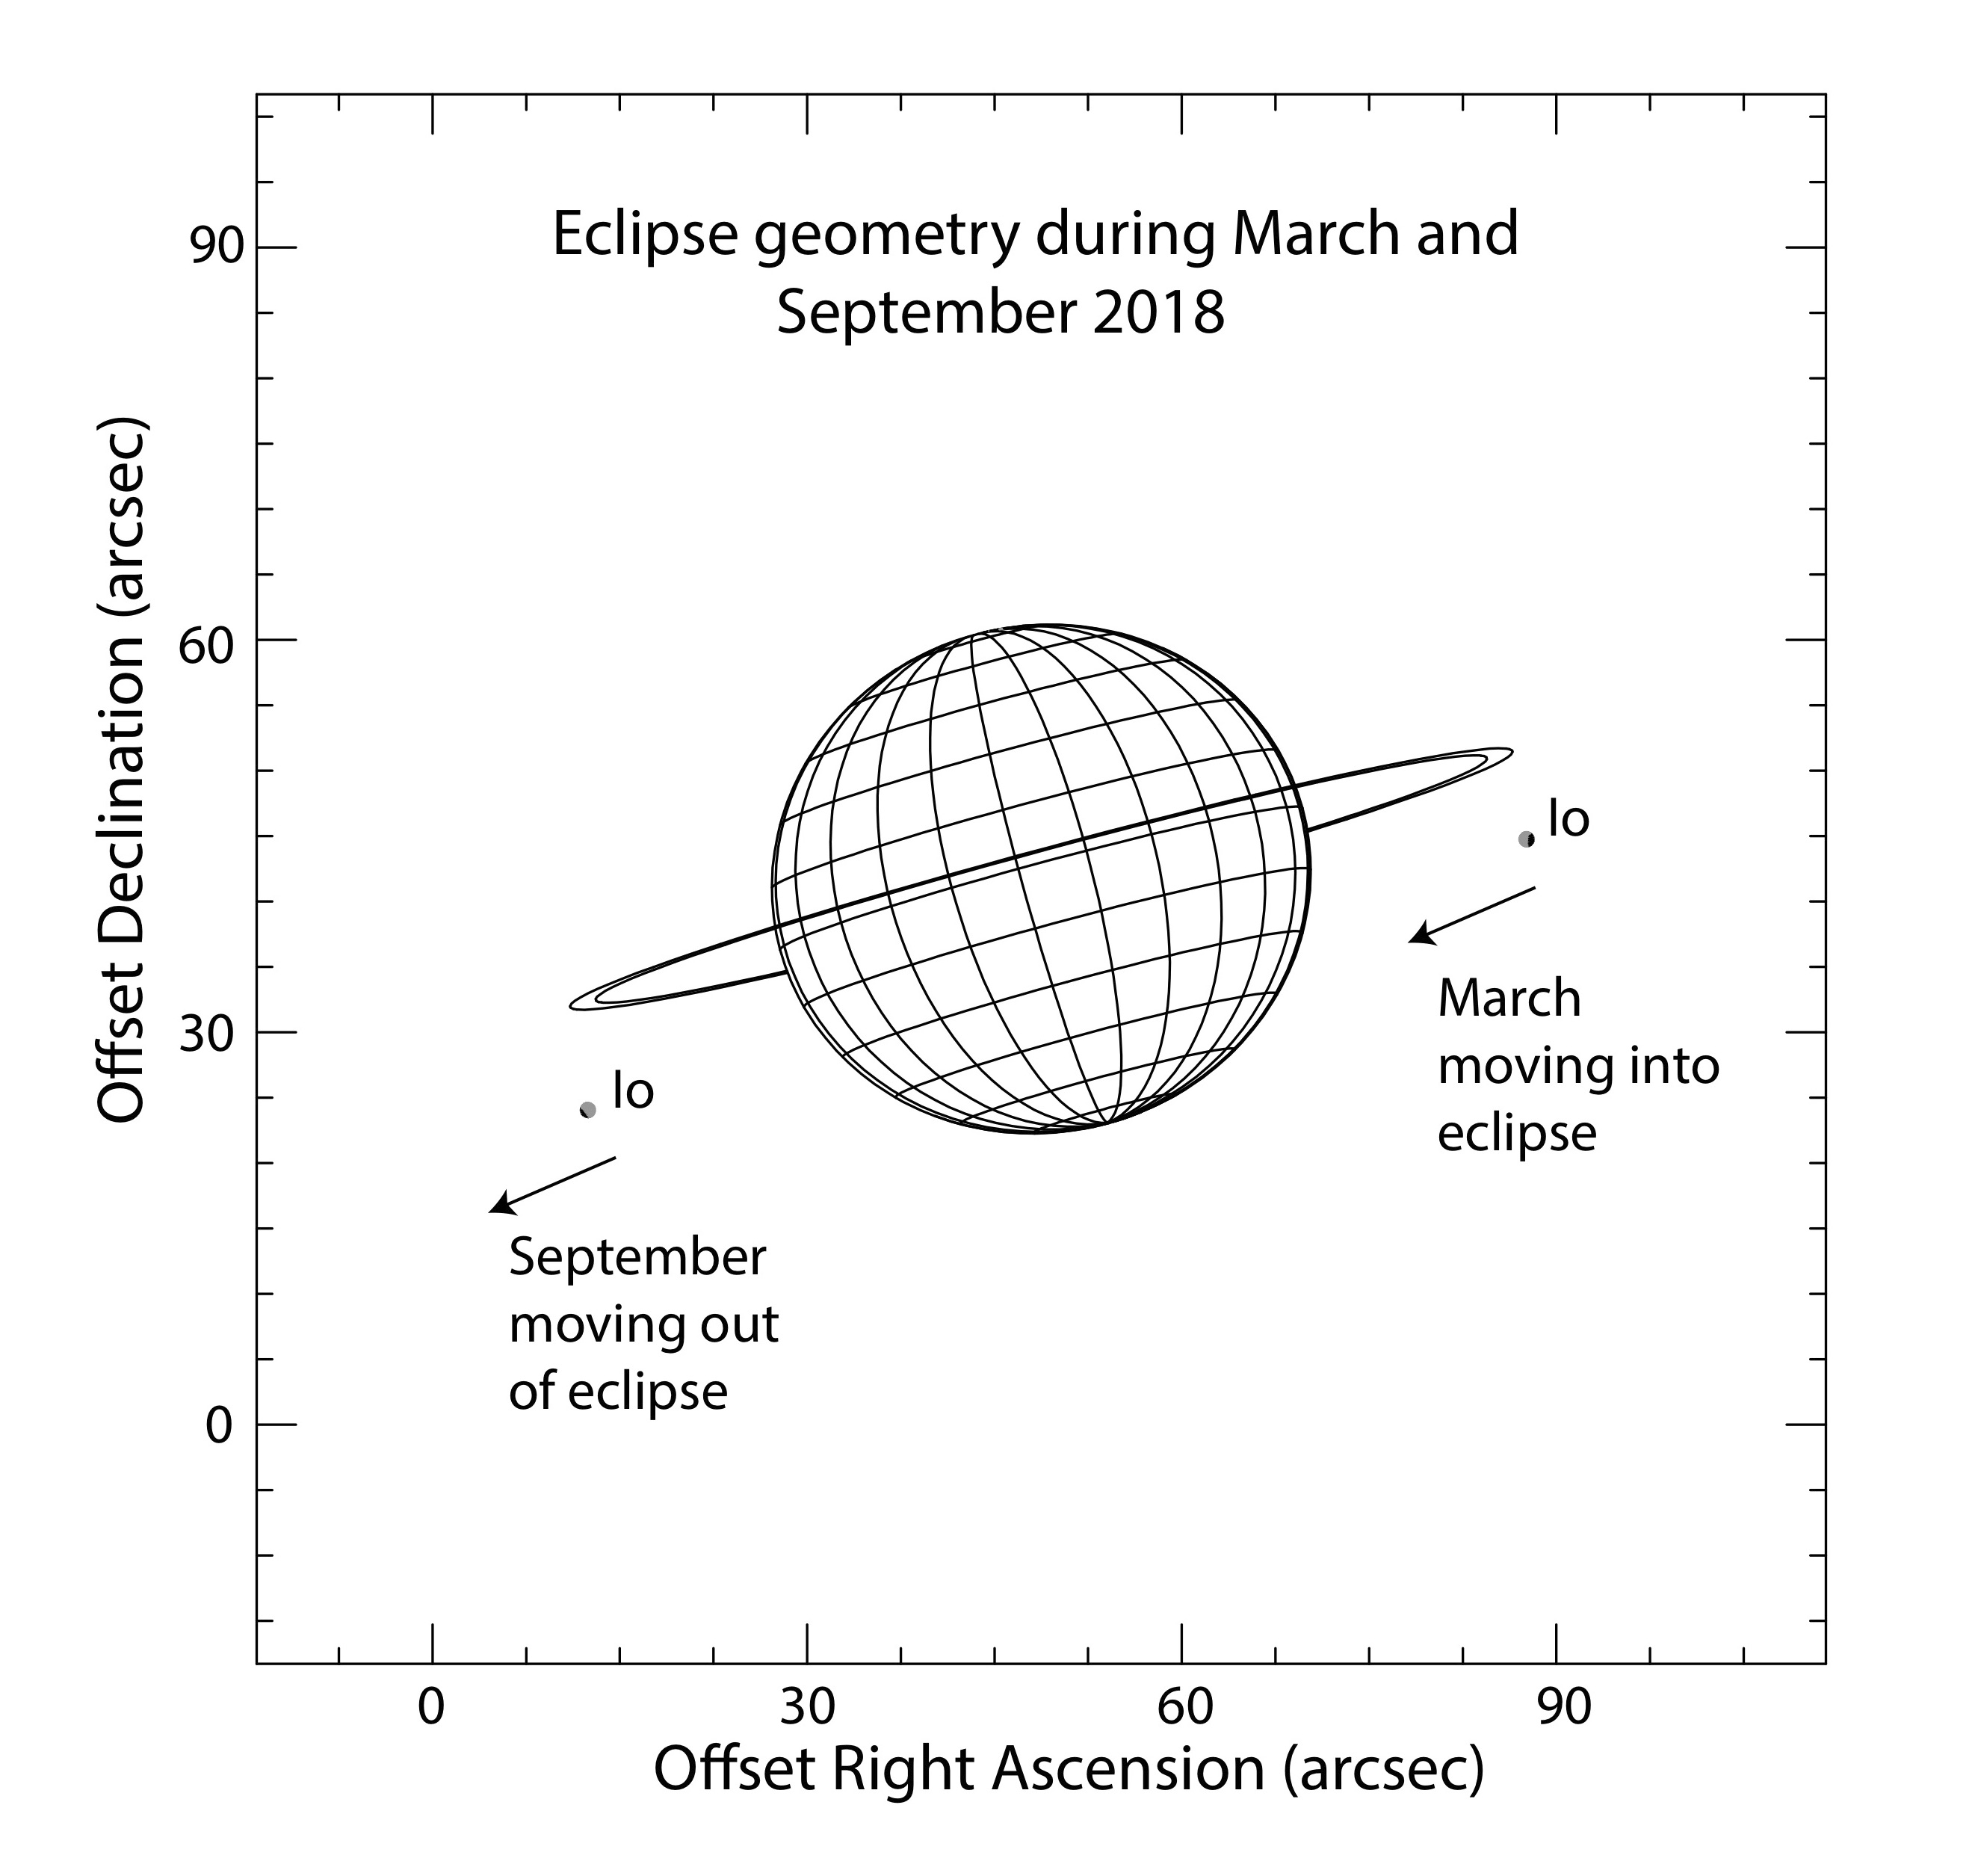
Geometries of Io moving into eclipse (2018 March) and coming out of eclipse (2018 September). (Adapted from the Planetary Ring Node:http://pds-rings. seti.org/tools/).
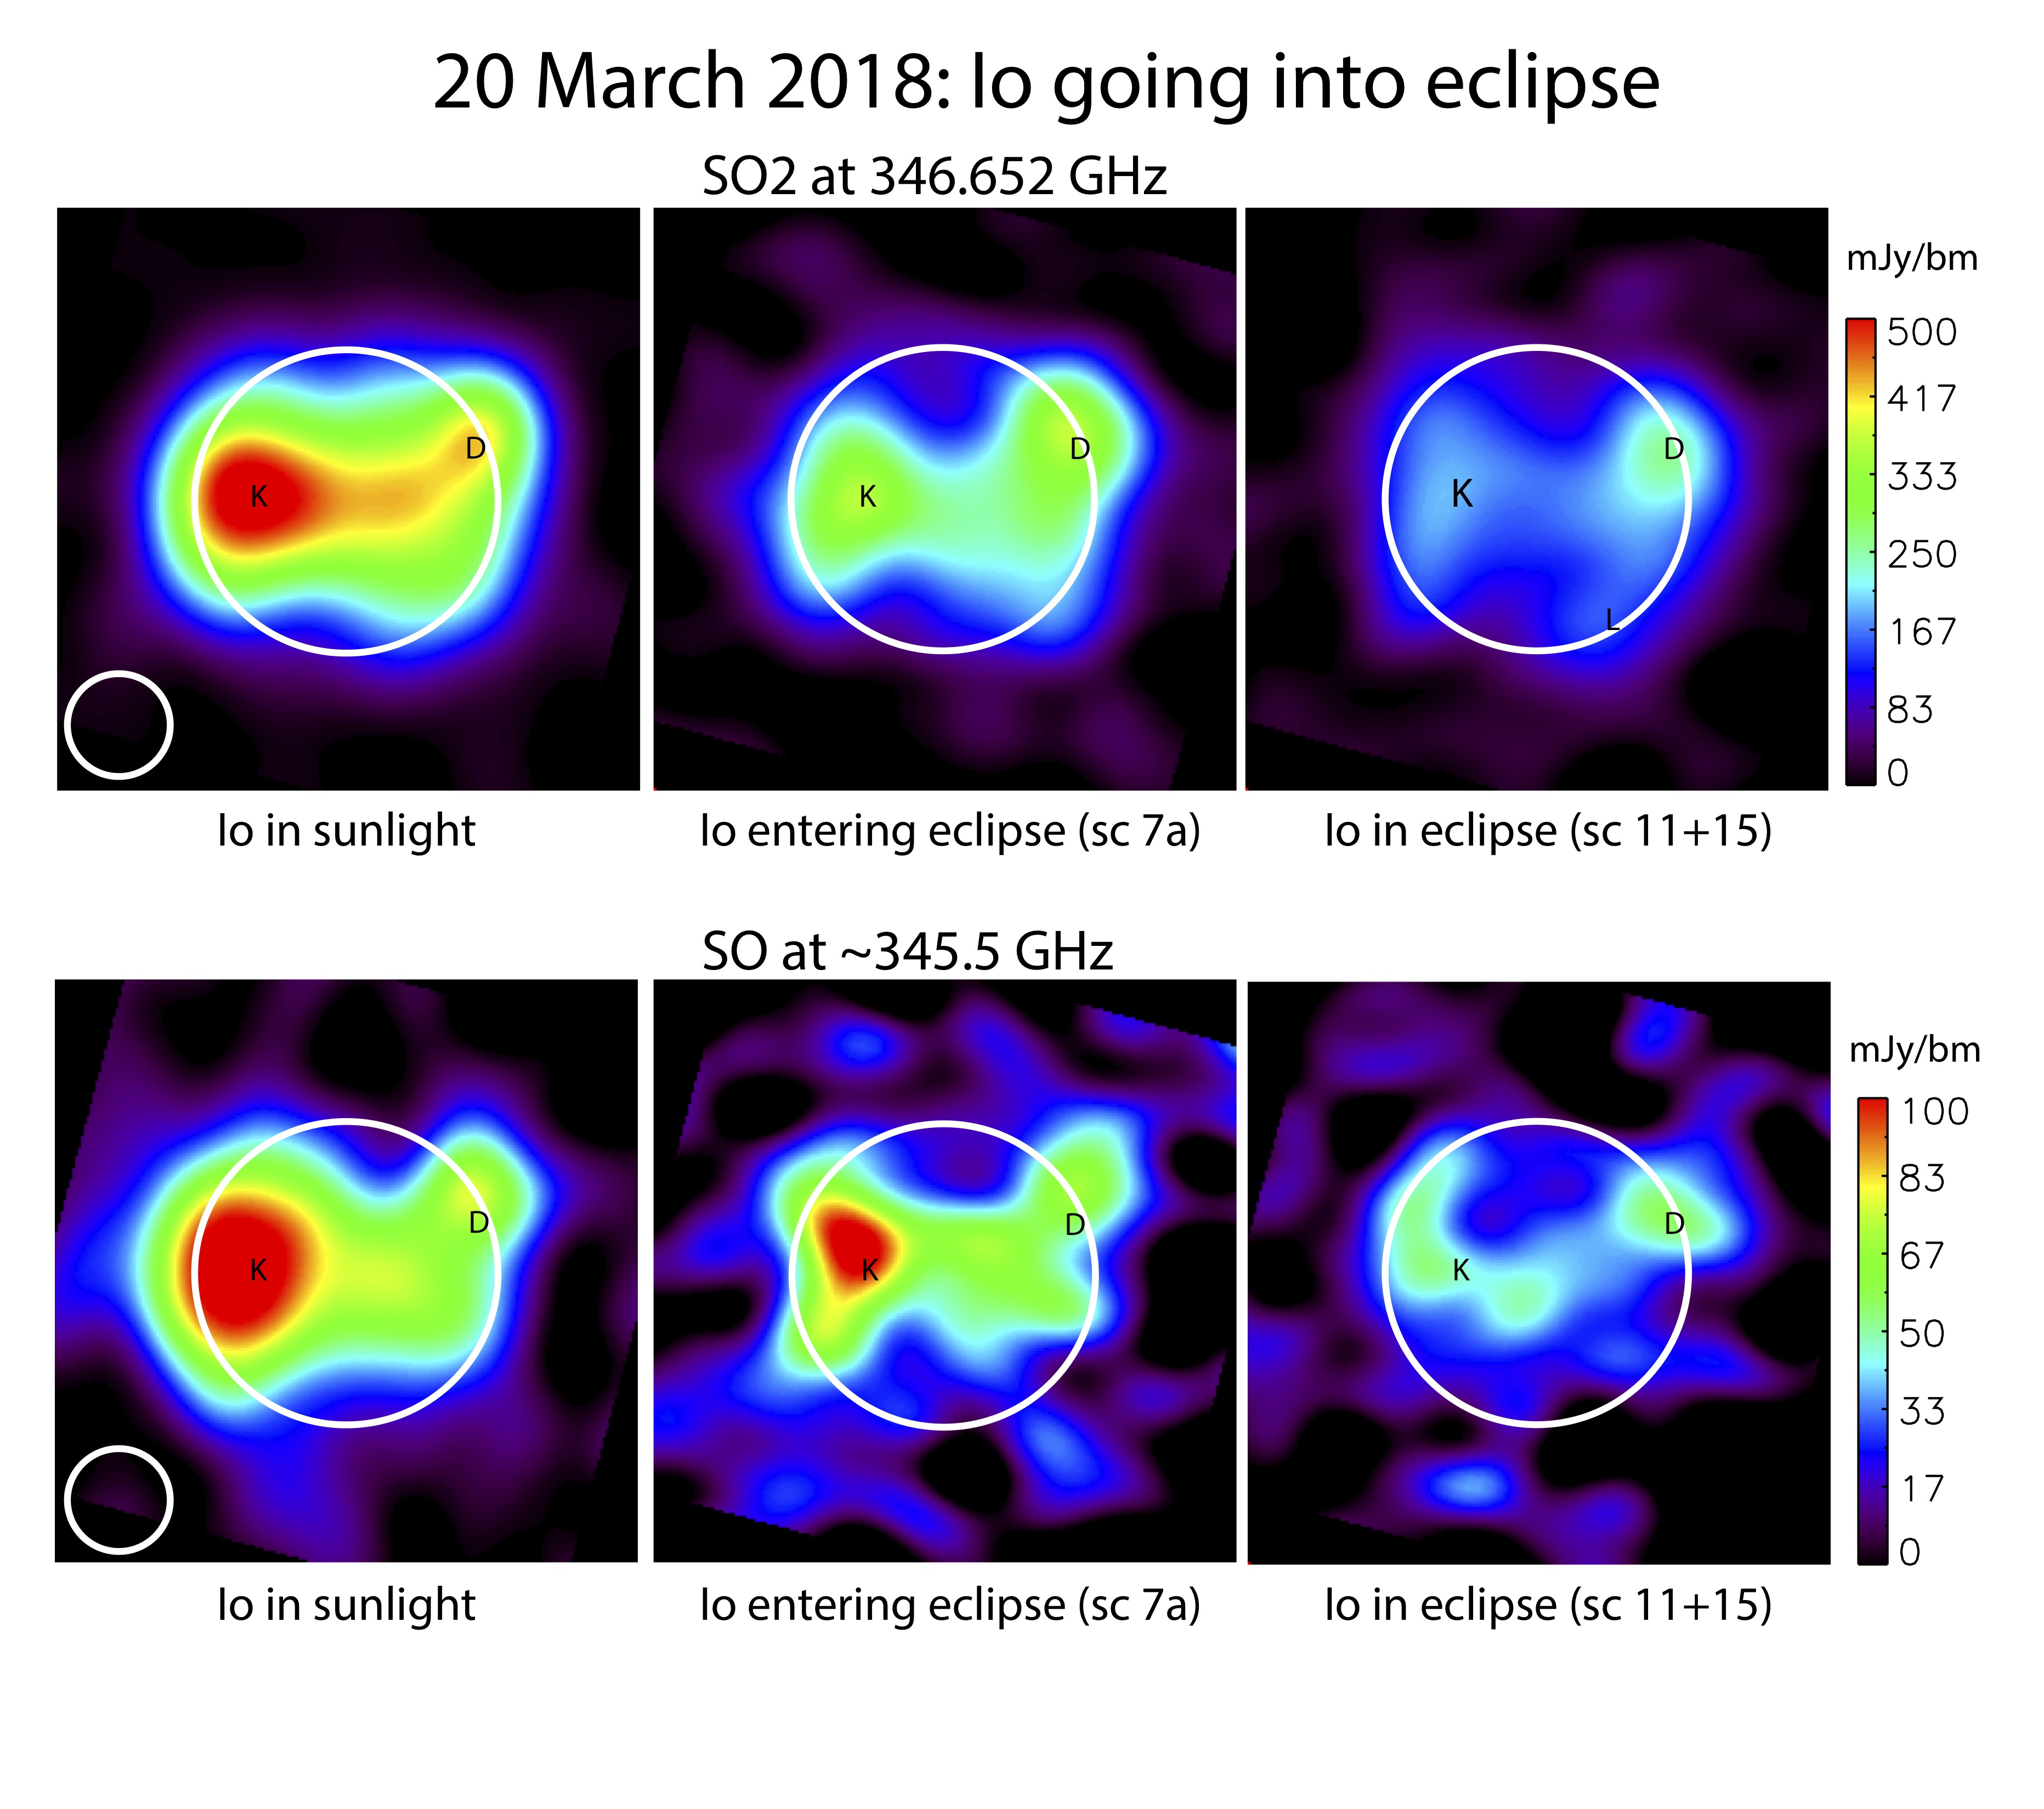
Top row: maps of the SO2 distribution on Io in sunlight, and ~6 (scan 7a) and ~15 (scans 11+15) minutes after entering eclipse. Bottom row: maps of the SO data taken at the same times as the SO2 maps. Io north is up in all frames. The large circle shows the outline of Io, and the small circle in the lower left shows the resolution, or size of the beam. The volcanoes Karei Patera (K), Daedalus Patera (D), and North Lerna (L, on one panel only) are indicated.
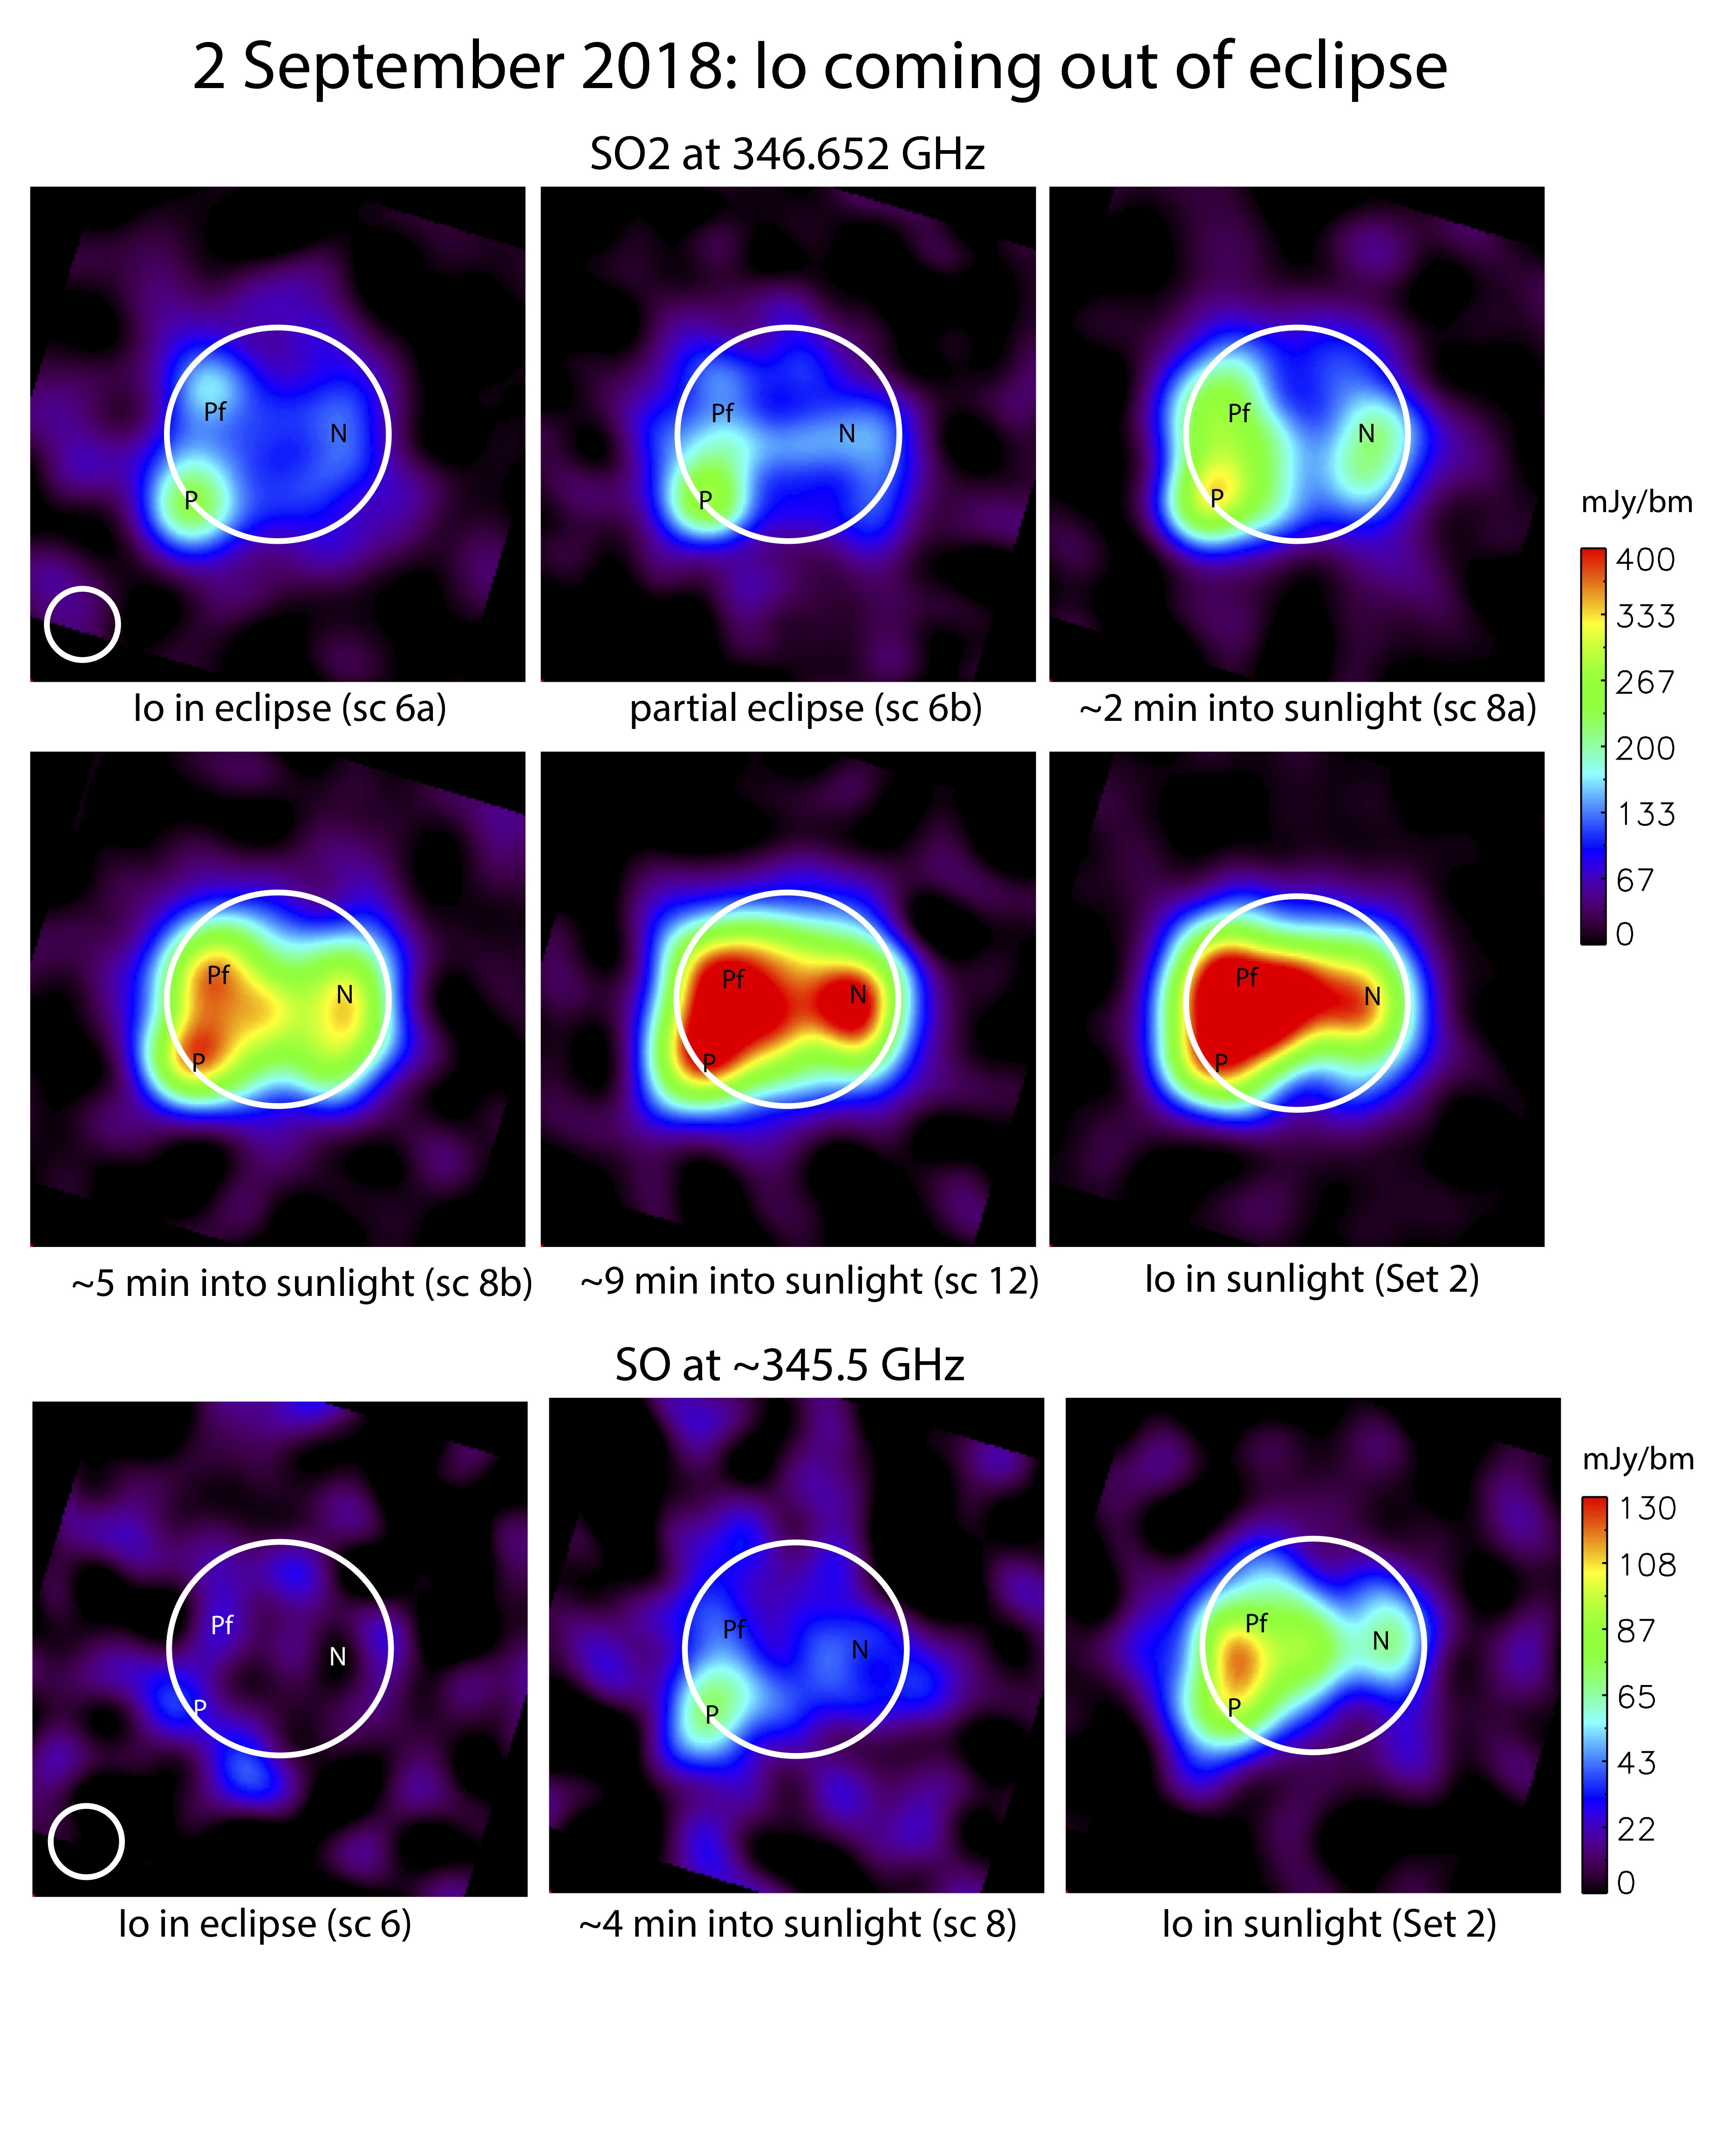
Top two rows: maps of the SO2 distribution on Io in eclipse (scan 6a), and emerging into sunlight on 2018 September 2, starting with a partial eclipse (scan 6b), as indicated. Bottom row: maps of the SO data. Io north is up. The large circle shows the outline of Io. The small circle in the lower left shows the HPBW. The letters show the positions of several volcanoes: P for P207, Pf for PFd1691, and N for Nyambe Patera.
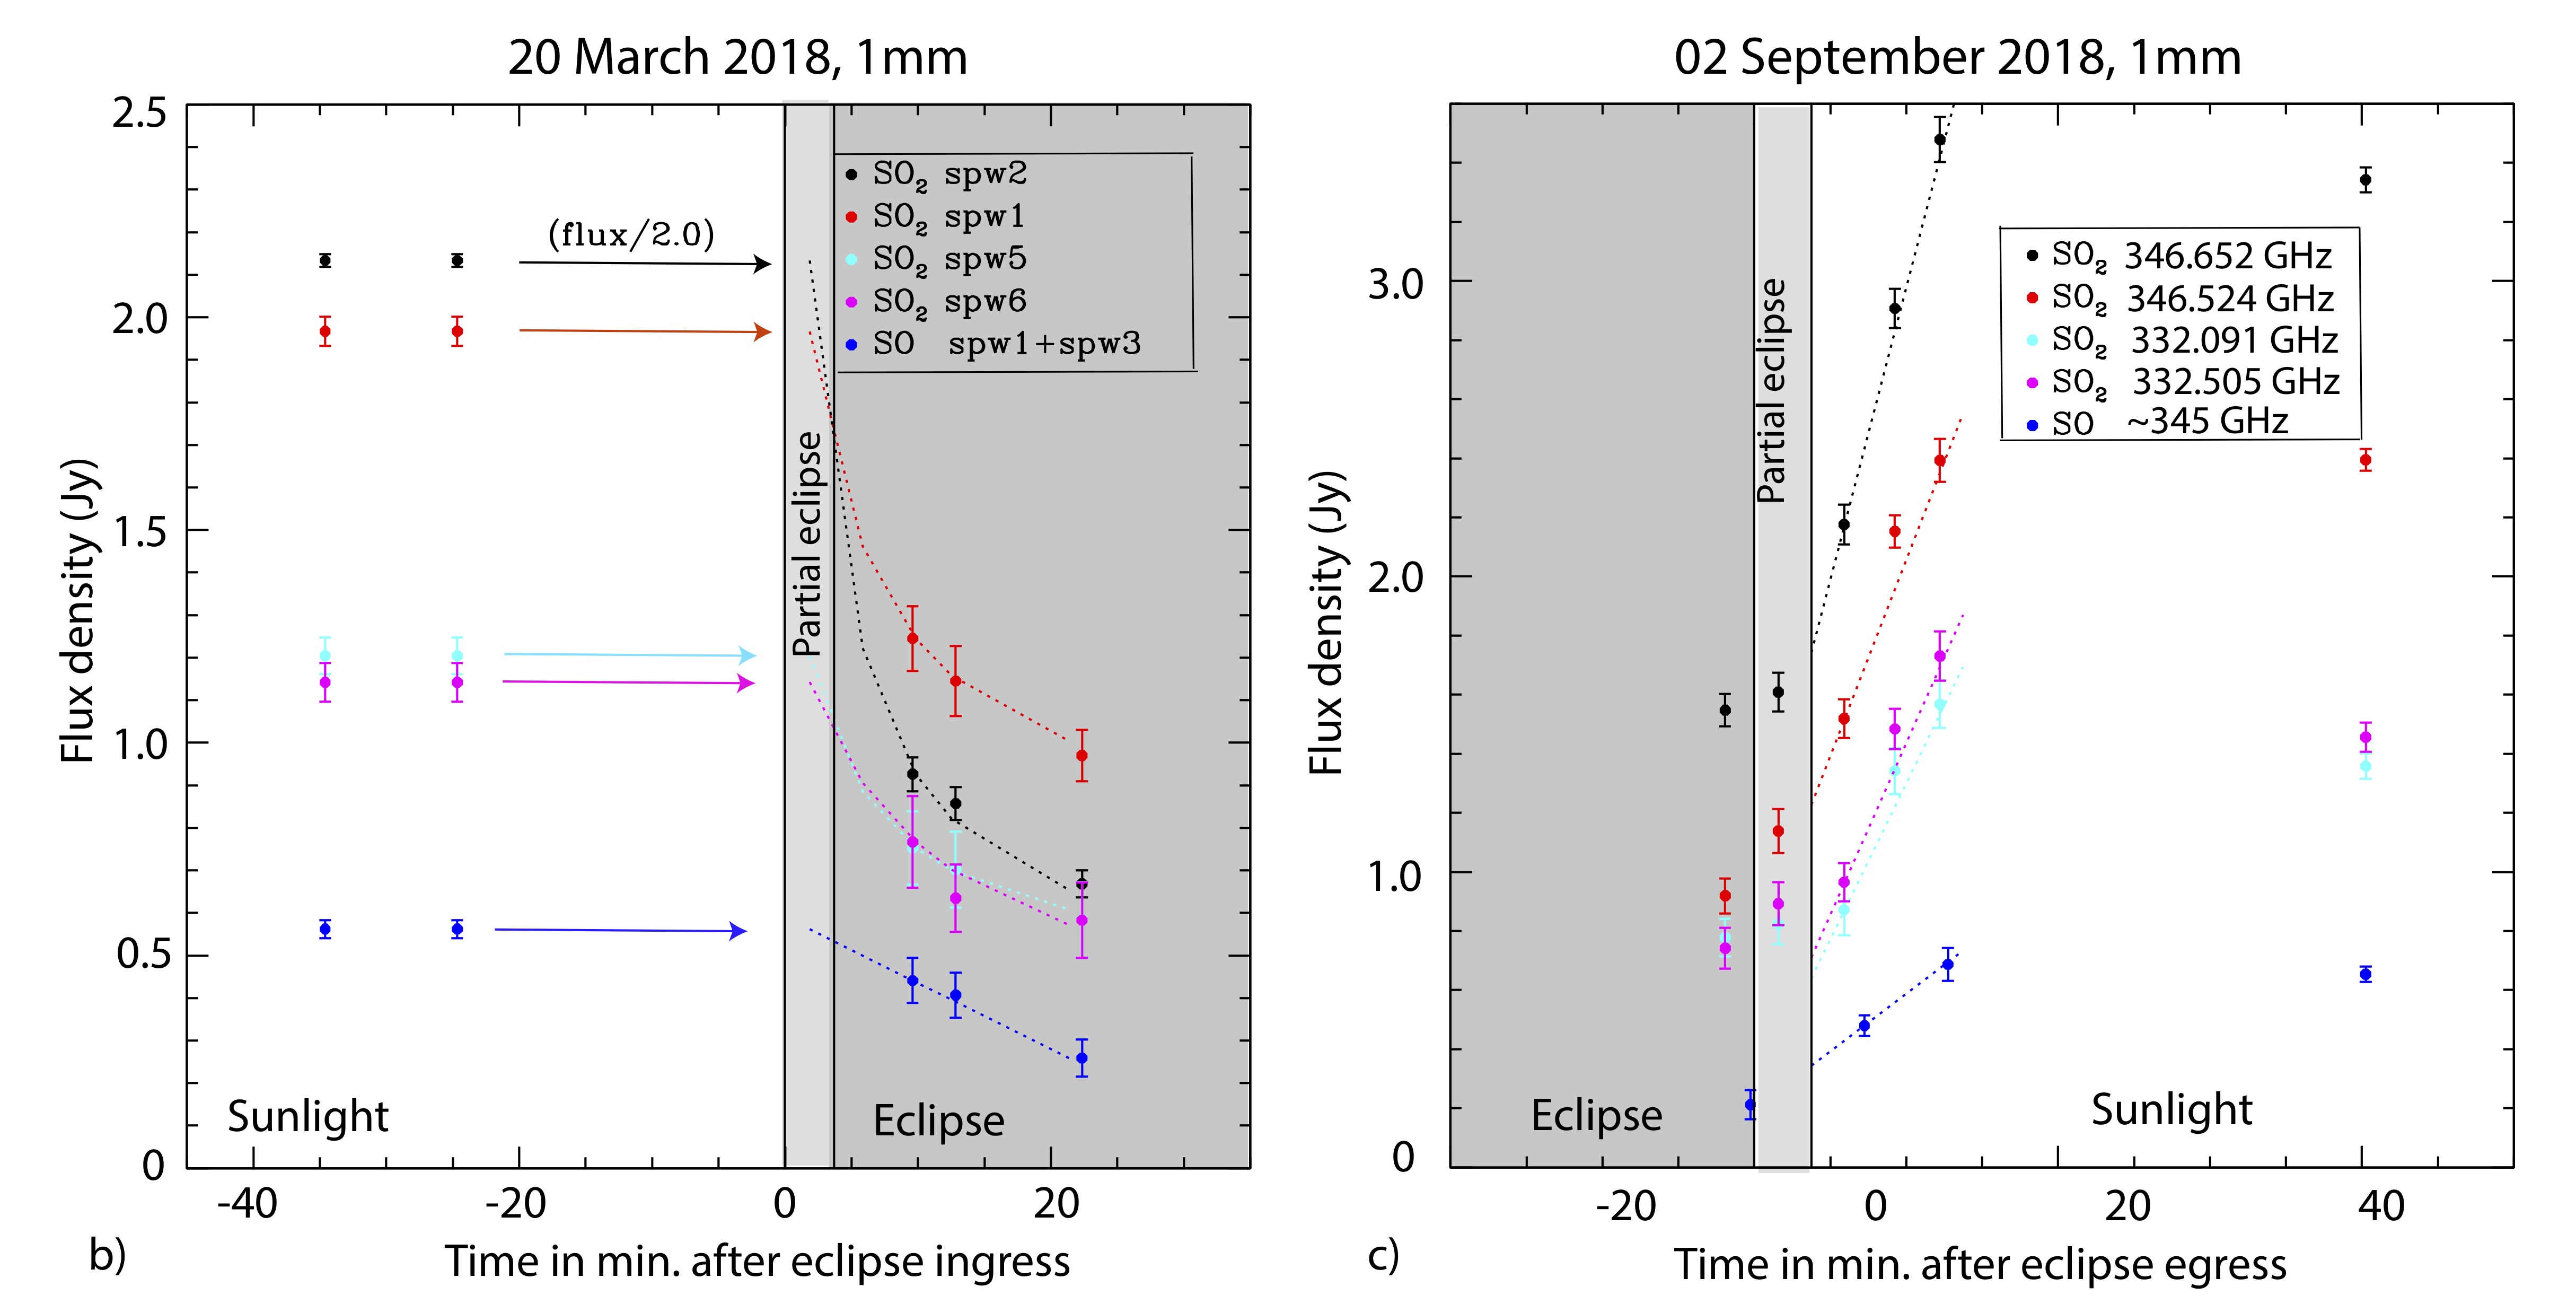
Flux densities integrated over individual maps as a function of time. The colors refer to different spectral windows. The dotted lines superposed on the data in panel (a) show the exponential decrease or the linear slope after entering eclipse, whichever is appropriate. In panel (b), the dotted lines show the linear increase after emerging from eclipse on September 2.
-----------------------------------------
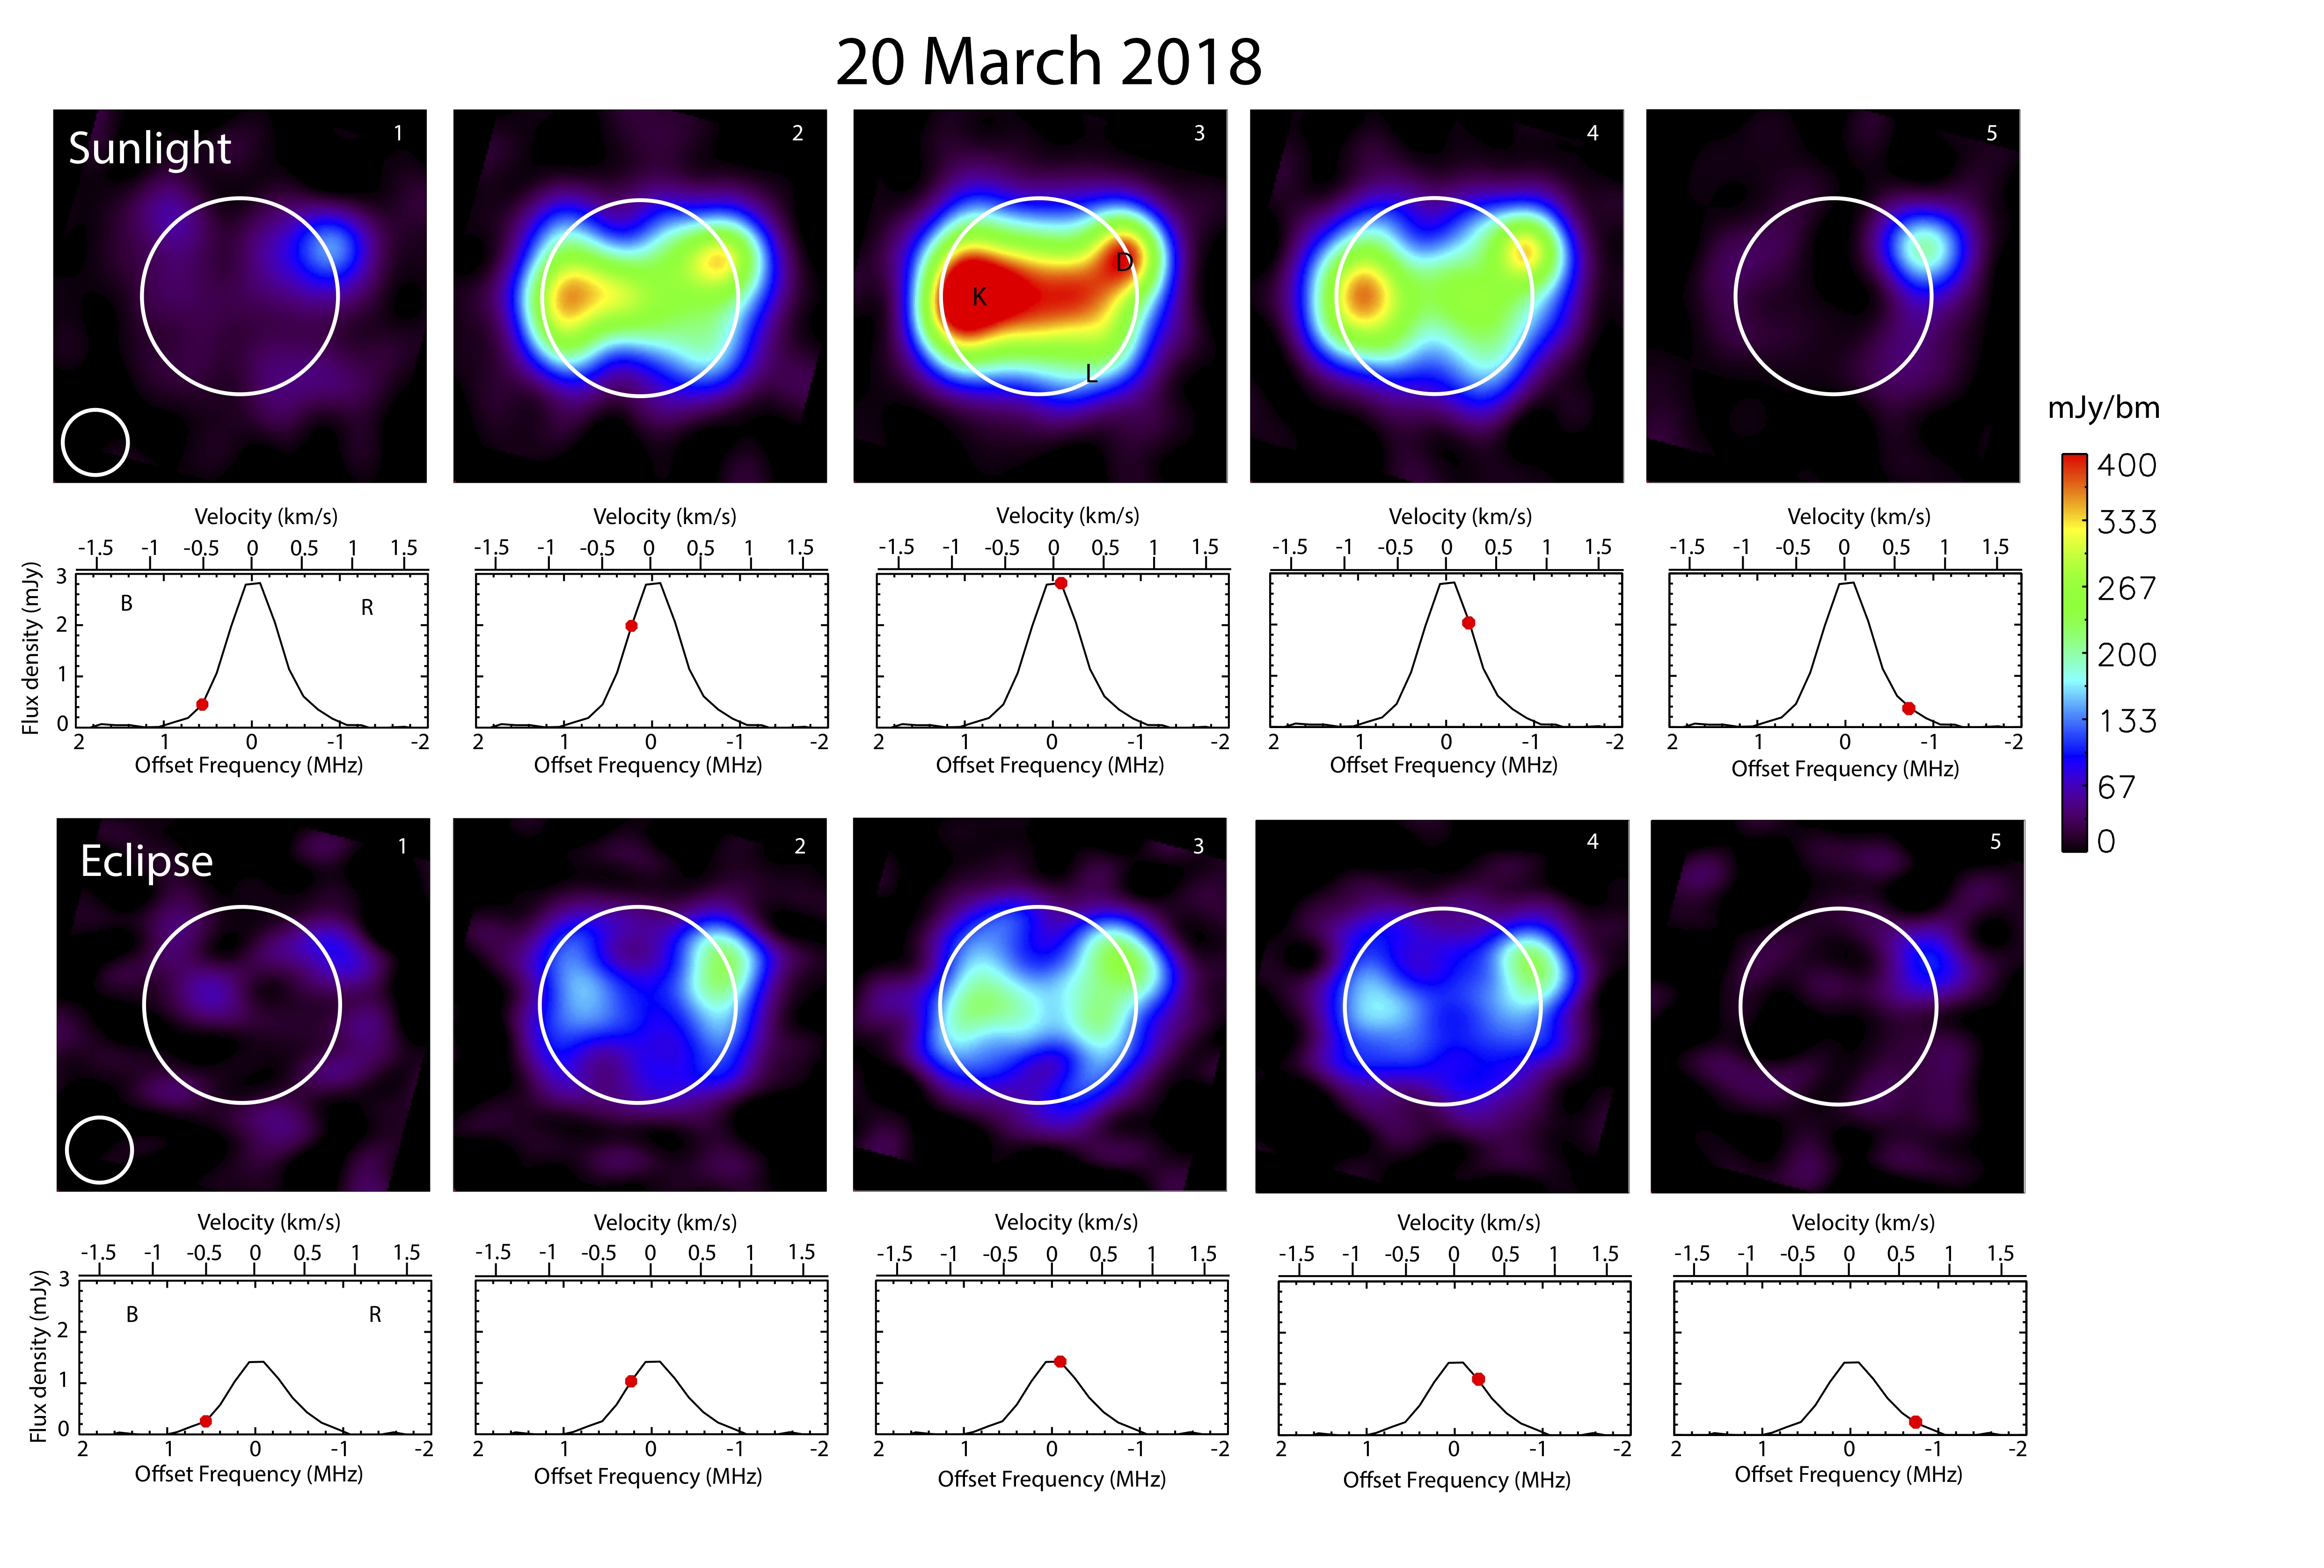
Individual frames at a few different frequencies (or velocities) from our March sunlight --> eclipse data for SO2. Below each frame, we show the line profile for the disk-integrated flux density as a function of offset frequency (from +2 to -2 MHz), with an approximate velocity scale at the top. The red dot on the line profile indicates the frequency of the map above. The symbols B and R stand for blueshift and redshift, respectively, i.e., gas moving toward (B) or away from us (R). Note that, just due to the rotation of Io, the west limb (left side of Io) moves toward us and the east limb away from us. The approximate positions of several volcanoes are indicated on frame 3, in sunlight (see Figure above for the symbols). Io north is up in these frames. The video below shows a 14 image sequence in sunlight (left) and in eclipse (right). The duration of the video is 7s.
-------------------------------------------
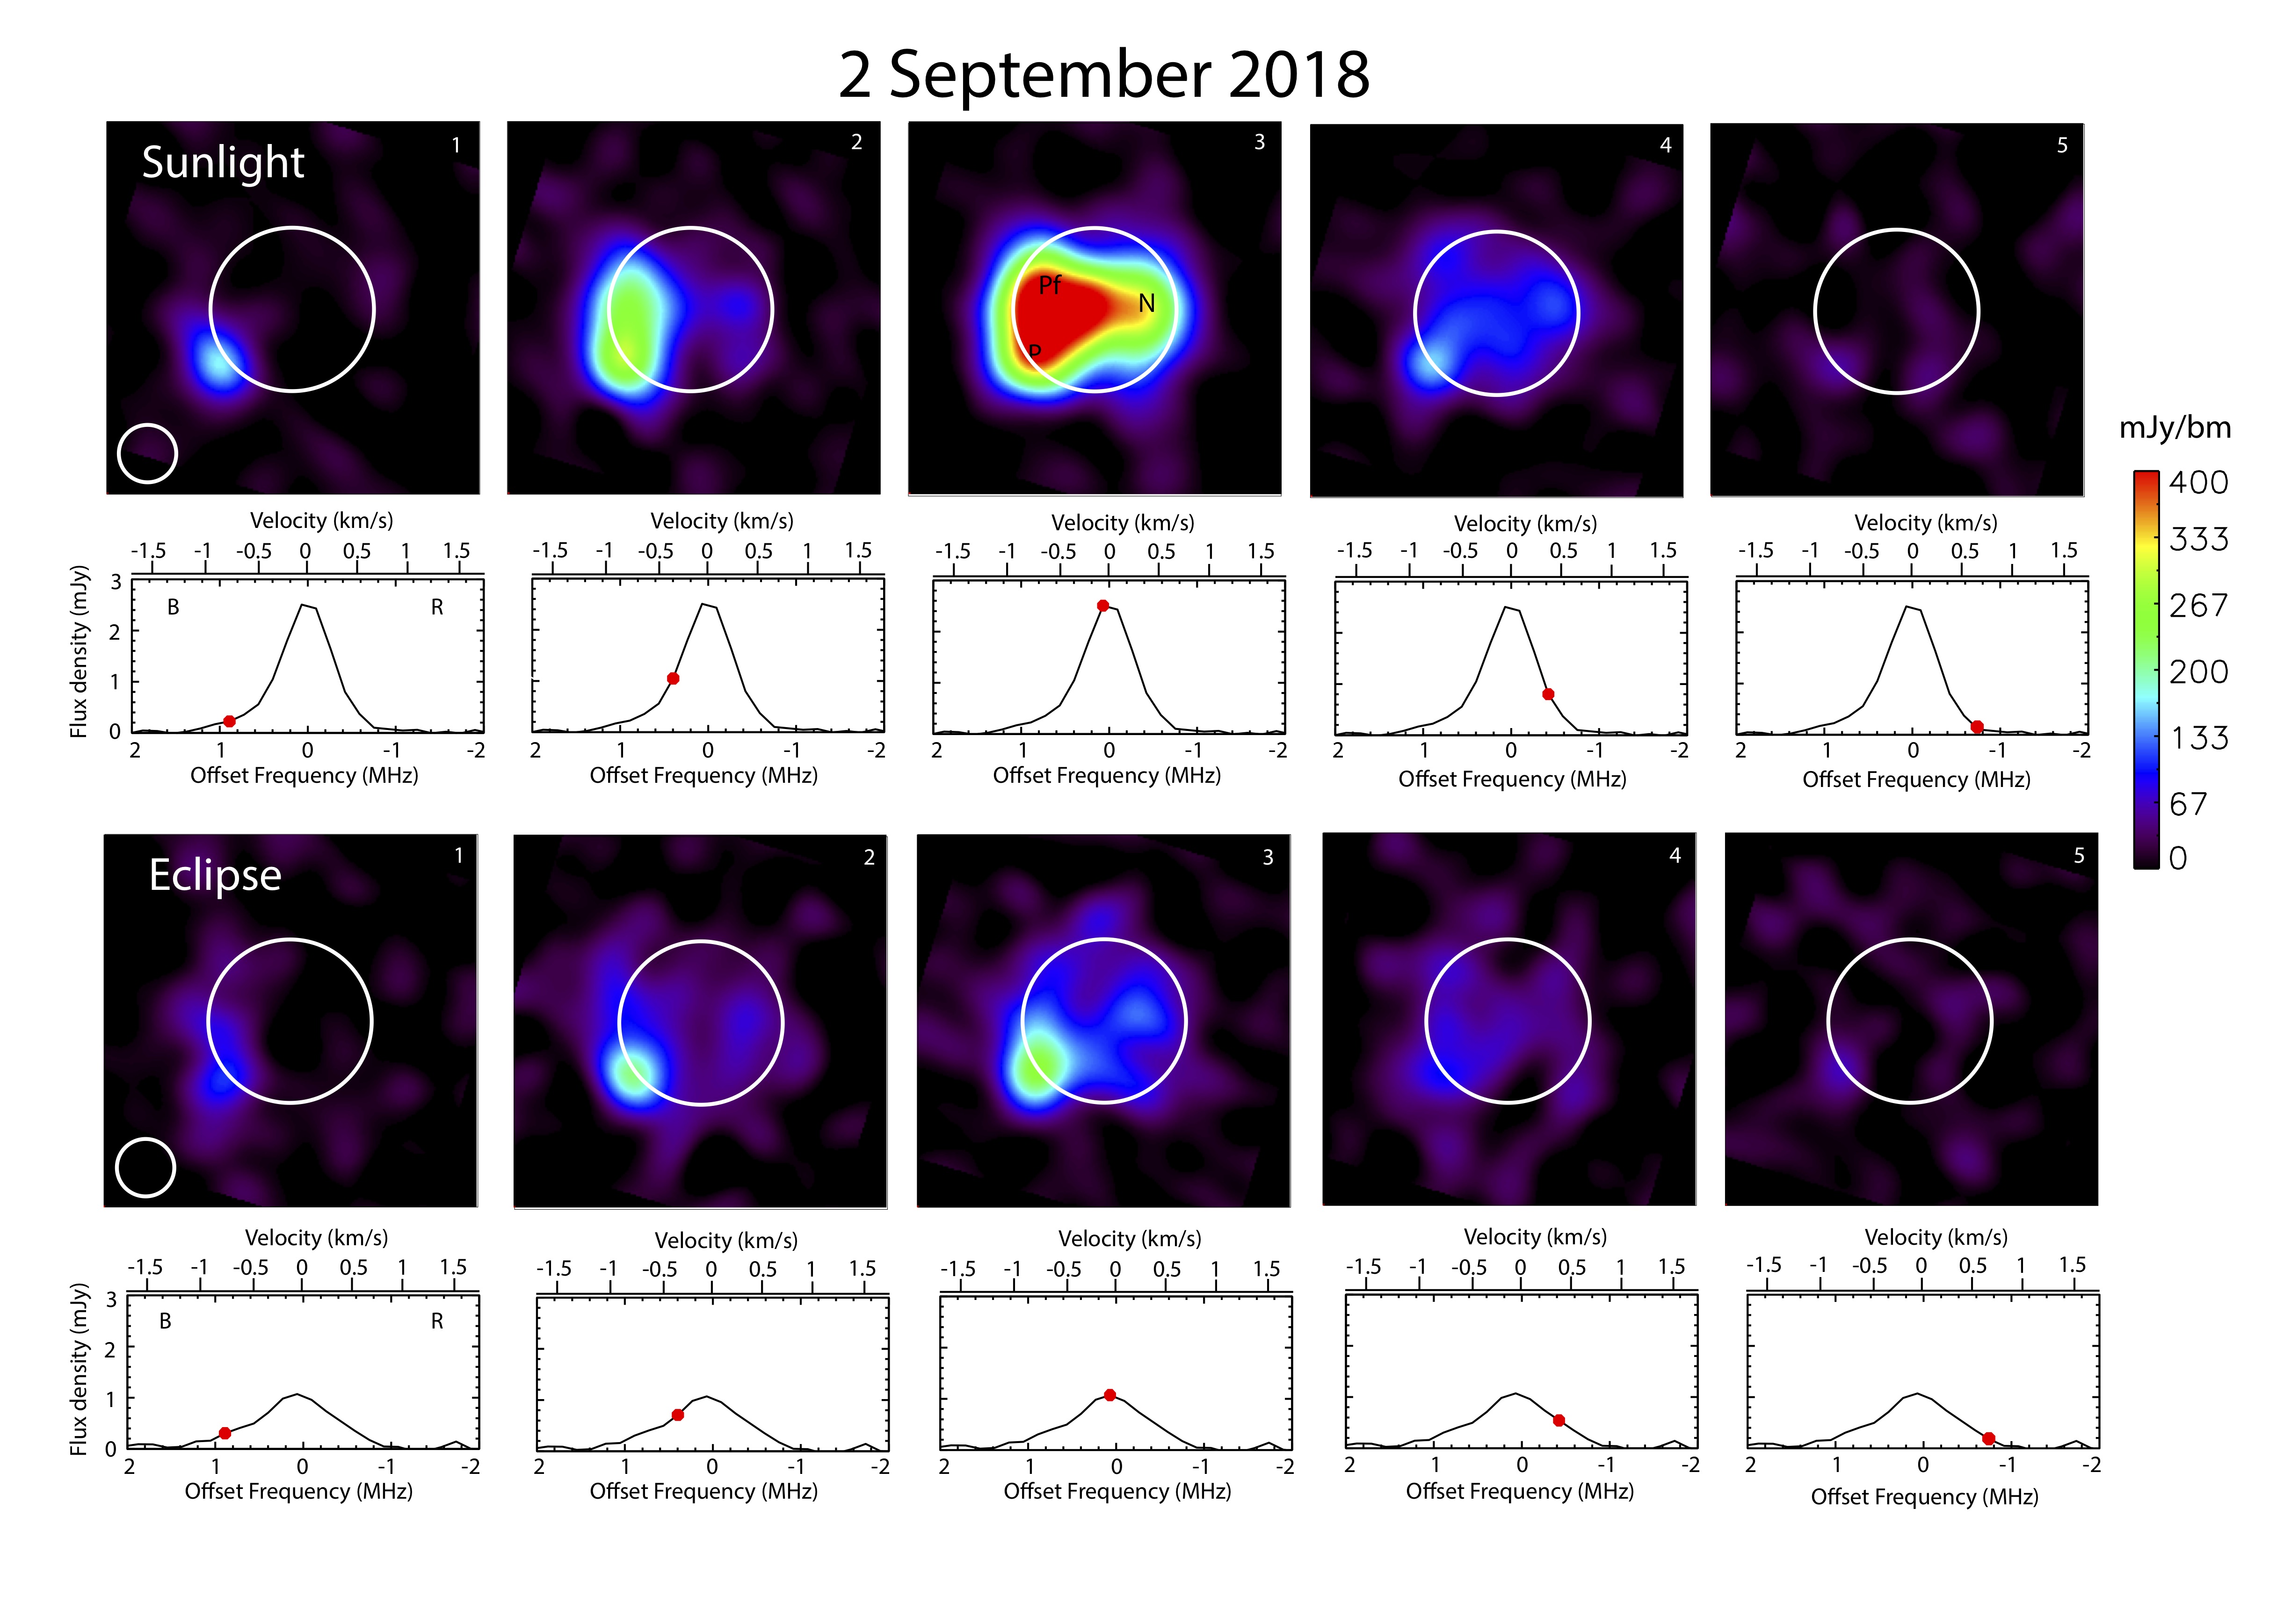
Individual frames at a few different frequencies (or velocities) from our September 2 eclipse --> sunlight data for SO2. Below each frame, we show the line profile for the disk-integrated flux density as a function of offset frequency (from +2 to -2 MHz), with an approximate velocity scale at the top. The red dot indicates the frequency of the map above. The symbols B and R stand for blueshift and redshift, respectively, i.e., gas moving toward (B) or away from us (R). Note that, just due to the rotation of Io, the west limb (left side of Io) moves toward us and the east limb away from us. The approximate positions of several volcanoes are indicated on frame 3, in sunlight (see Figure above for the symbols). Io north is up in these frames. The video below shows a 16 image sequence in sunlight (left) and in eclipse (right). The duration of the video is 8s.