ALMA RADIO MAPS OF JUPITER AT HIGH SPATIAL RESOLUTION
We observed Jupiter's
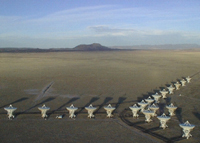
We obtained the first maps of Jupiter at 1-3 mm wavelength with the
Atacama Large Millimeter/Submillimeter Array (ALMA) on 2017 January
3-5, just days after an energetic eruption at 16.5 deg South
jovigraphic latitude had been reported by the amateur community, and
about two to three months after the detection of similarly energetic
eruptions in the northern hemisphere, at 22.2-2.0 Northern
latitude. Our observations probe below the ammonia cloud deck, and show that the erupting plumes in the South Equatorial Belt bring up ammonia gas from the deep atmosphere. While models of plume eruptions that are triggered at the water condensation level explain data taken at uv-visible and mid-infrared wavelengths, our ALMA observations provide a crucial, hitherto missing, link in the moist convection theory by showing that ammonia gas from the deep atmosphere is indeed brought up in these plumes. Contemporaneous Hubble Space Telescope data show that the plumes reach altitudes as high as the tropopause. We suggest that the plumes at 22.2-23.0N also rise up well above the ammonia cloud deck and that descending air may dry the neighboring belts even more than in quiescent times, which would explain our observations in the north.
de Pater, I., Sault, R.J., Moeckel, C., Moullet, A., Wong, M.H.,
Goullaud,C., DeBoer,D., Butler, B., Bjoraker, B., Adamkovics, M.,
Cosentino, R., Donnelly, P.T., Fletcher, L.N., Kasaba, Y., Orton, G.,
Rogers, J., Sinclair, J., Villard, E., 2019. First ALMA millimeter wavelength maps of Jupiter,
with a multi-wavelength study of convection. Astron. J.,
158, 139 (17 pp). https://doi.org/10.3847/1538-3881/ab3643
>>See Press Release UCB:2019/08/22<<
>>See Press Release NRAO:2019/08/20<<
Images and Movies from the Paper and Press Release are shown below.
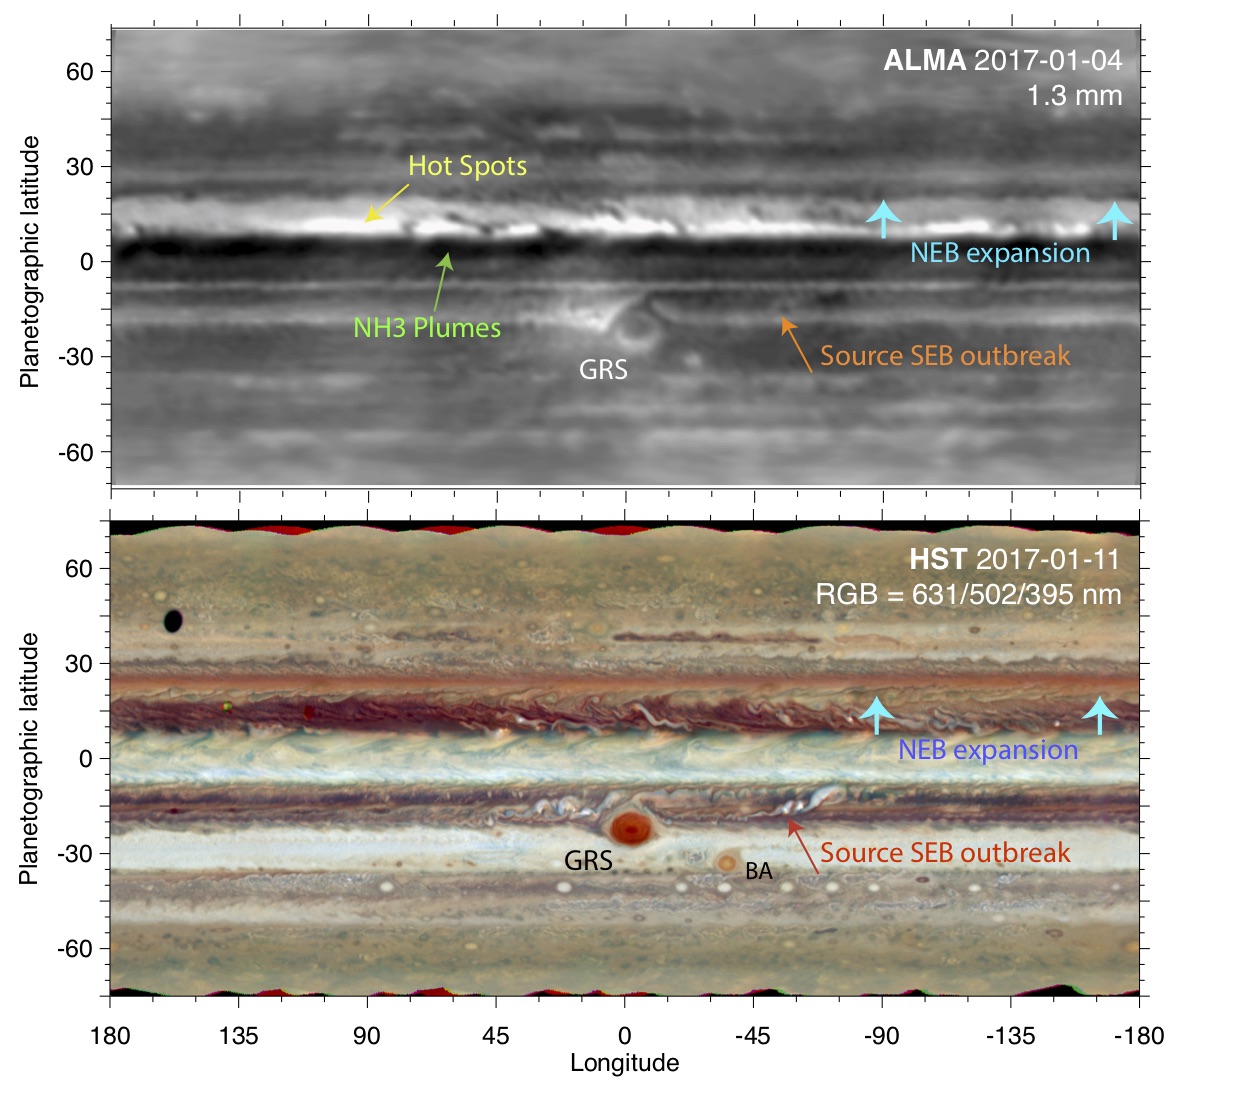
Top: ALMA map at 1.3 mm, constructed from data taken 2017 January
3-5. Bottom: HST map from 2017 January 11 Various features are
indicated, such as the iconic GRS and Oval BA (the latter is not
vissible in the ALMA map). The NEB expansion and the source of the
SEB outbreak are the focus of this paper. (Fig. adapted from the
paper).
|

Artists' animation showing Jupiter in radio waves with ALMA and in visible light with the Hubble Space Telescope (HST).
Credit: ALMA (ESO/NAOJ/NRAO), I. de Pater et al.; NRAO/AUI NSF,
S. Dagnello; NASA/Hubble (see NRAO Press release)
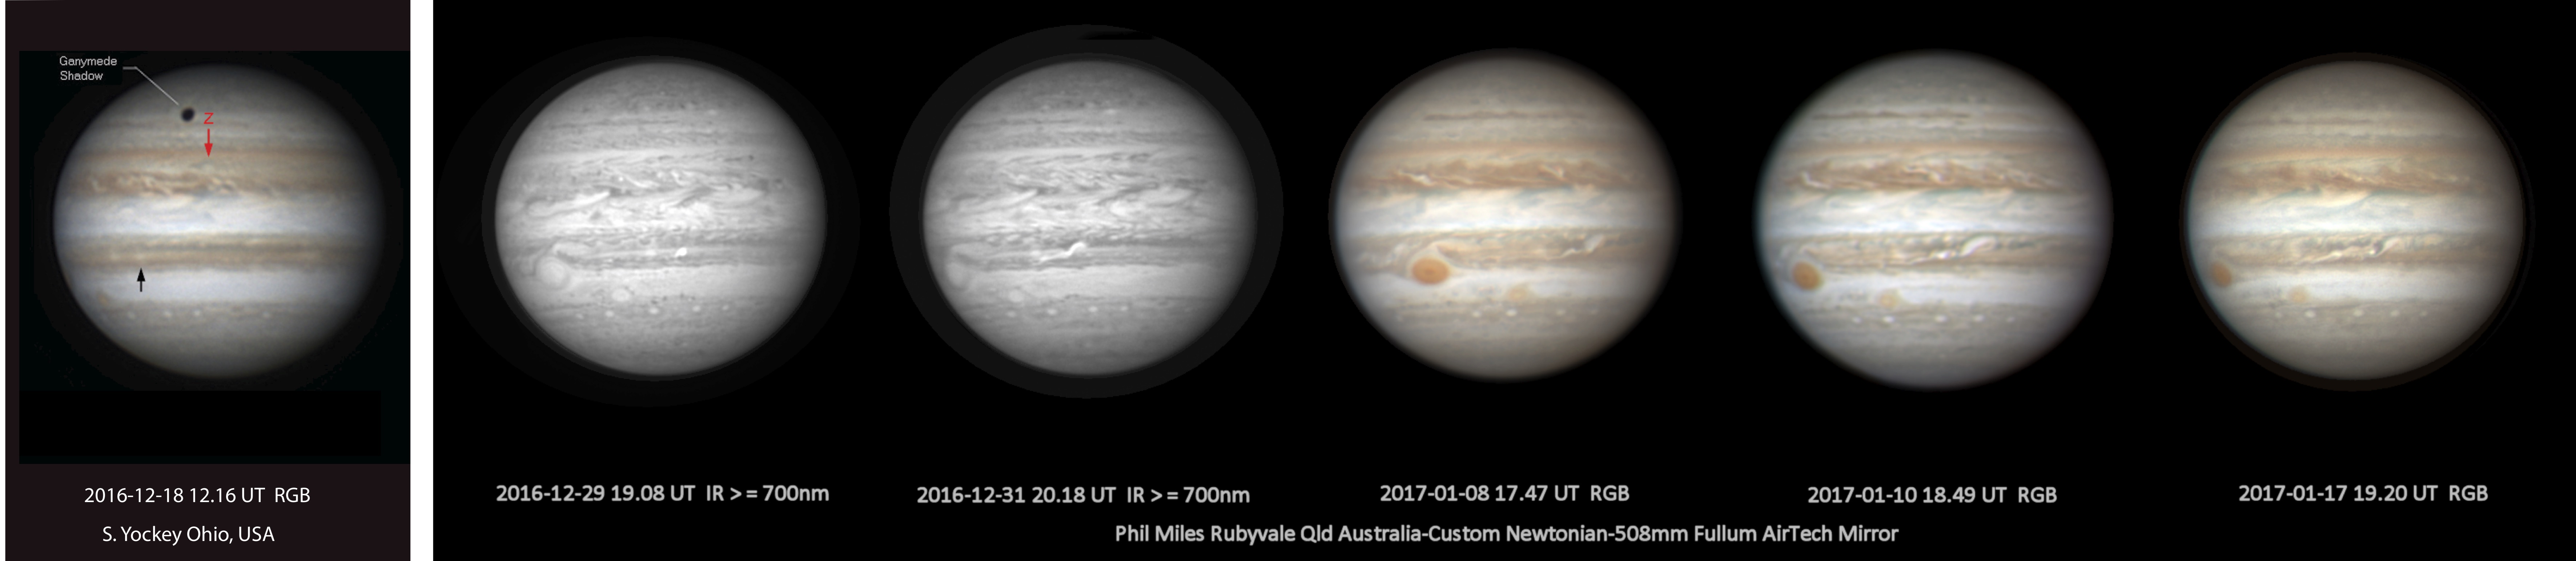
Images in visible light spanning the origin of the SEB outbreak. A pre-outbreak image on 2016 December 28, discovery image on 2016 December 29, and subsequent images on 2016 December 31 and 2017 January 8, 10 and 17. The source of the outbreak remains fixed near 208deg System II, and the disturbance propagates to the east, as shown by the sequence of images. (Courtesy of S. Yockey, Ohio, USA; Phil Miles, Australia).
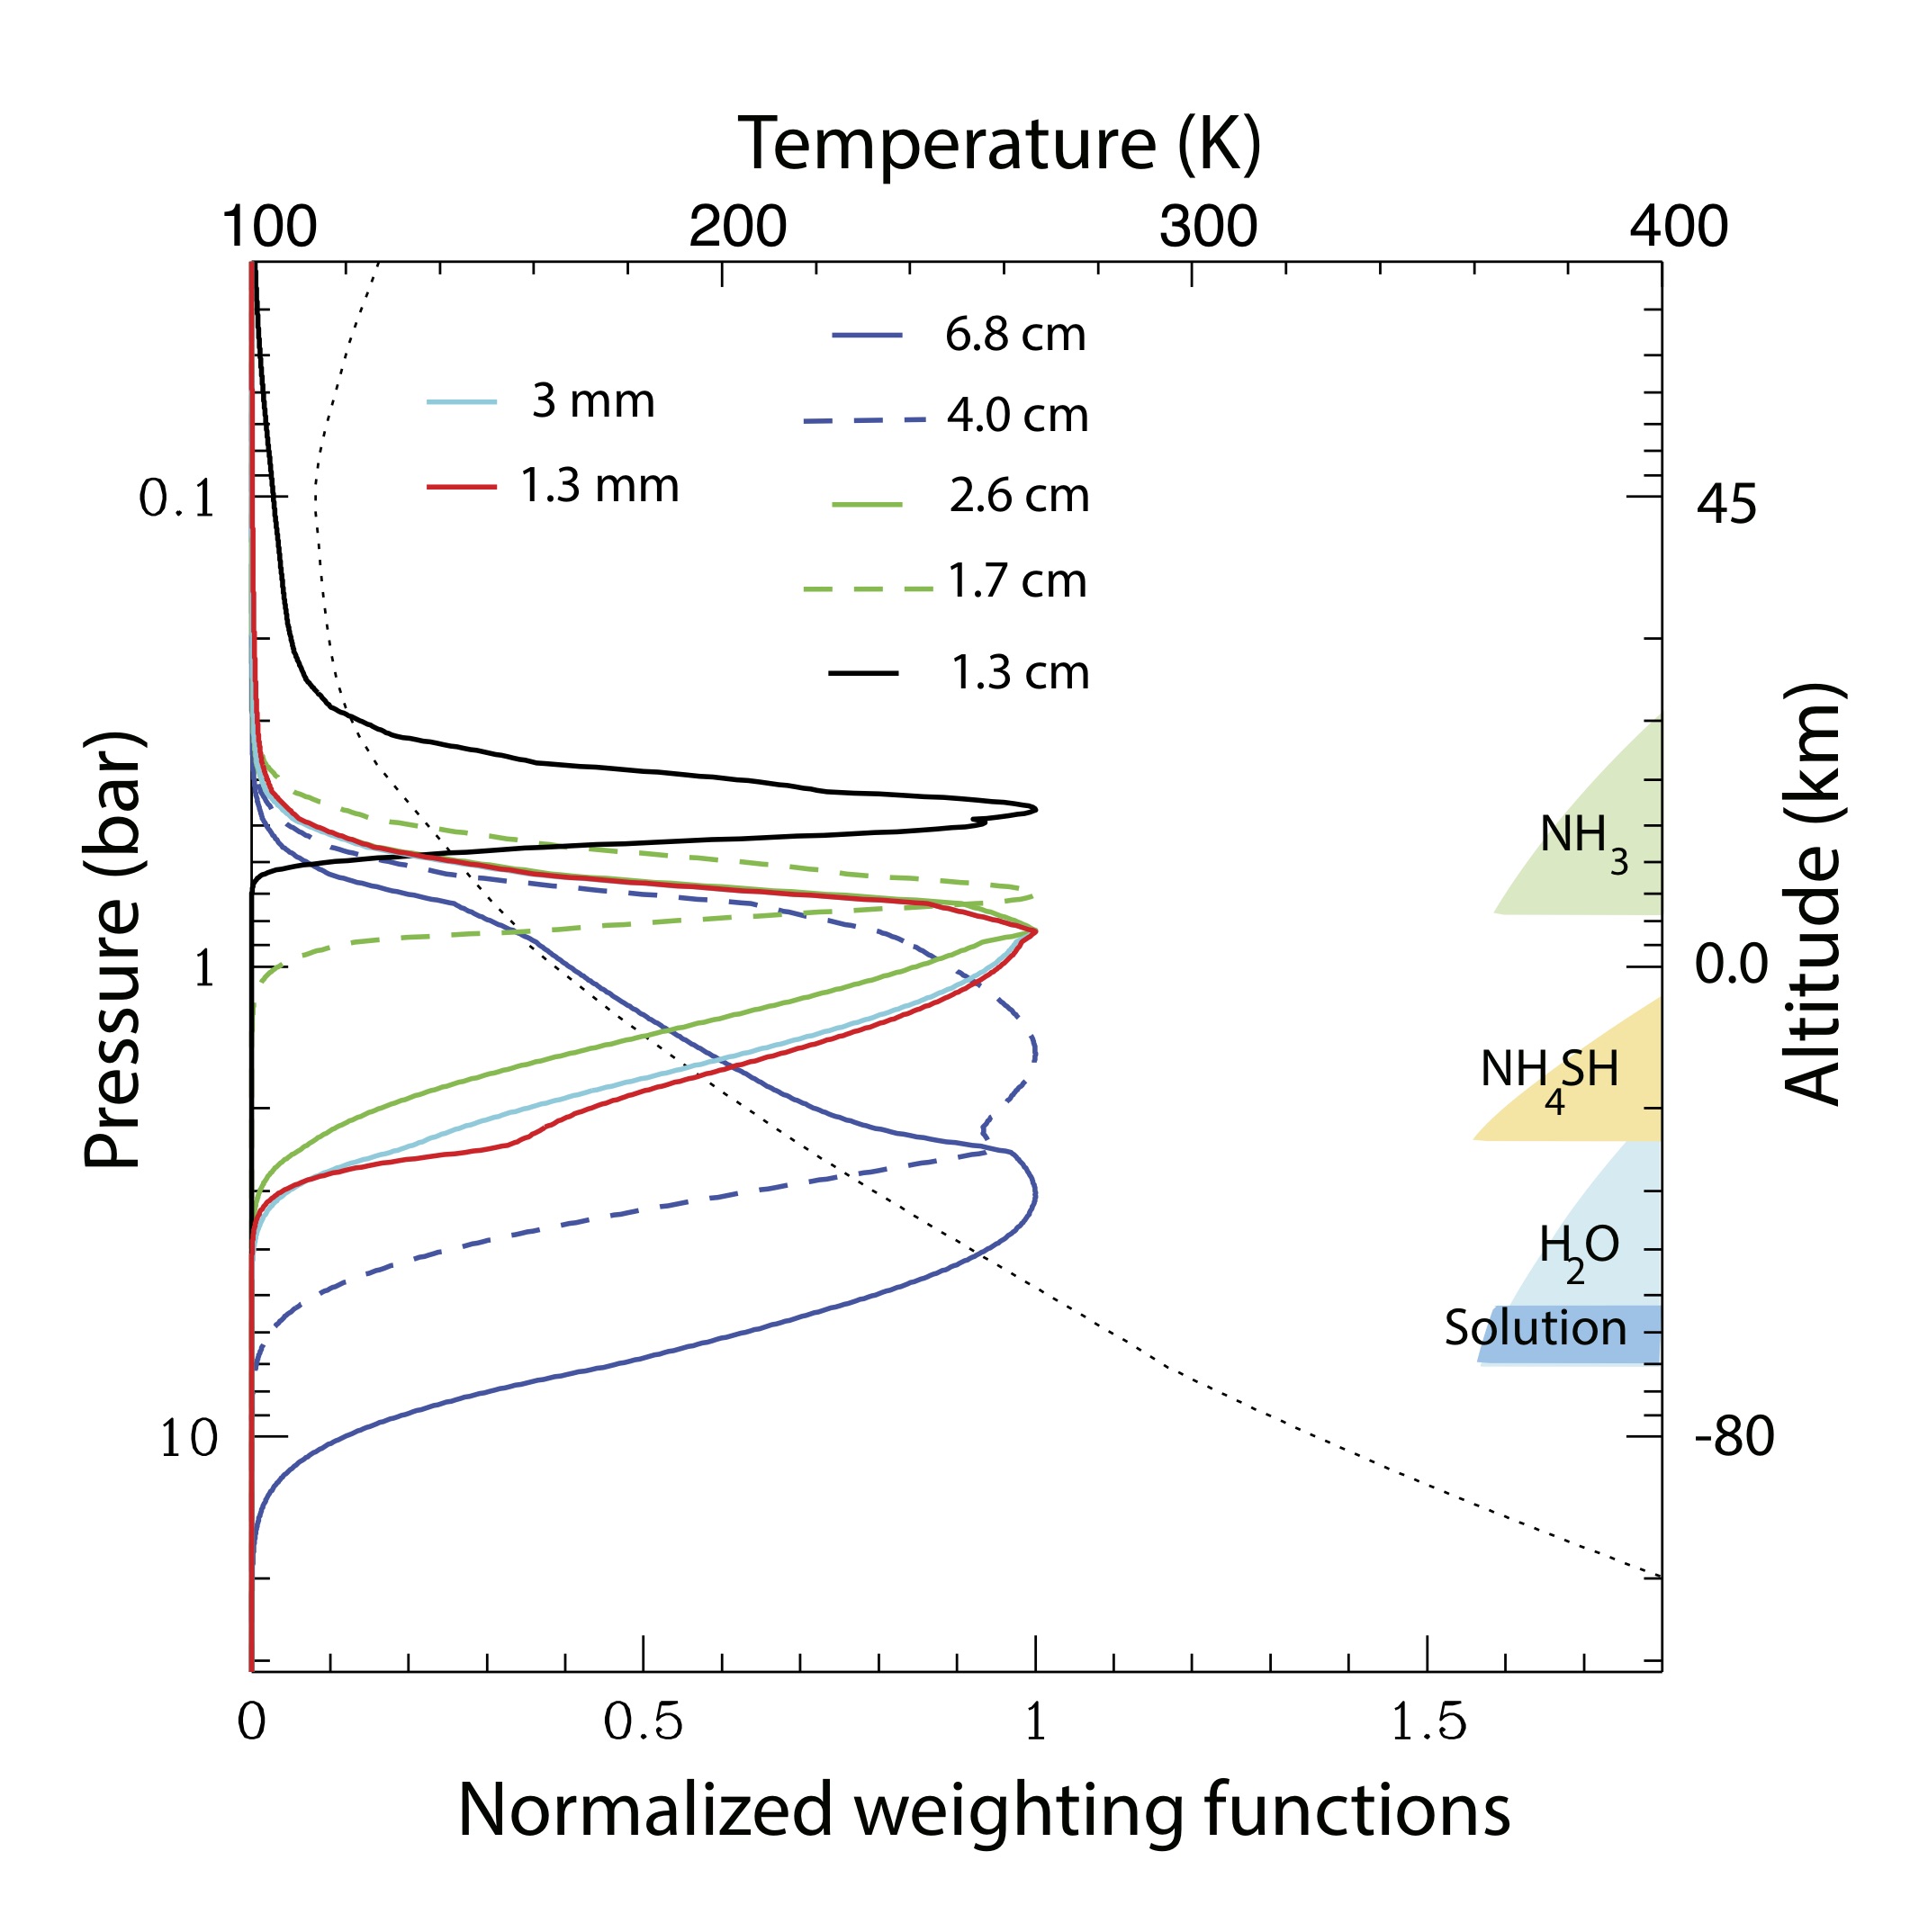
At radio wavelengths we probe below the cloud layers. In this figure
we show weighting functions for our nominal atmosphere in
thermochemical equilibrium, under nadir viewing conditions. The
temperature profile is shown by the dotted line (wet adiabat). In our nominal atmosphere, the abundances of CH4, H2O, and Ar in the deep atmosphere are enhanced by a factor of 4 over the solar values, and NH3 and H2S are enhanced by a factor of 3.2 each. On the right-hand side, we indicate the various cloud layers expected to form in thermochemical equilibrium. The weighting functions move down in the atmosphere if there is less NH3 gas, such as in the NEB.
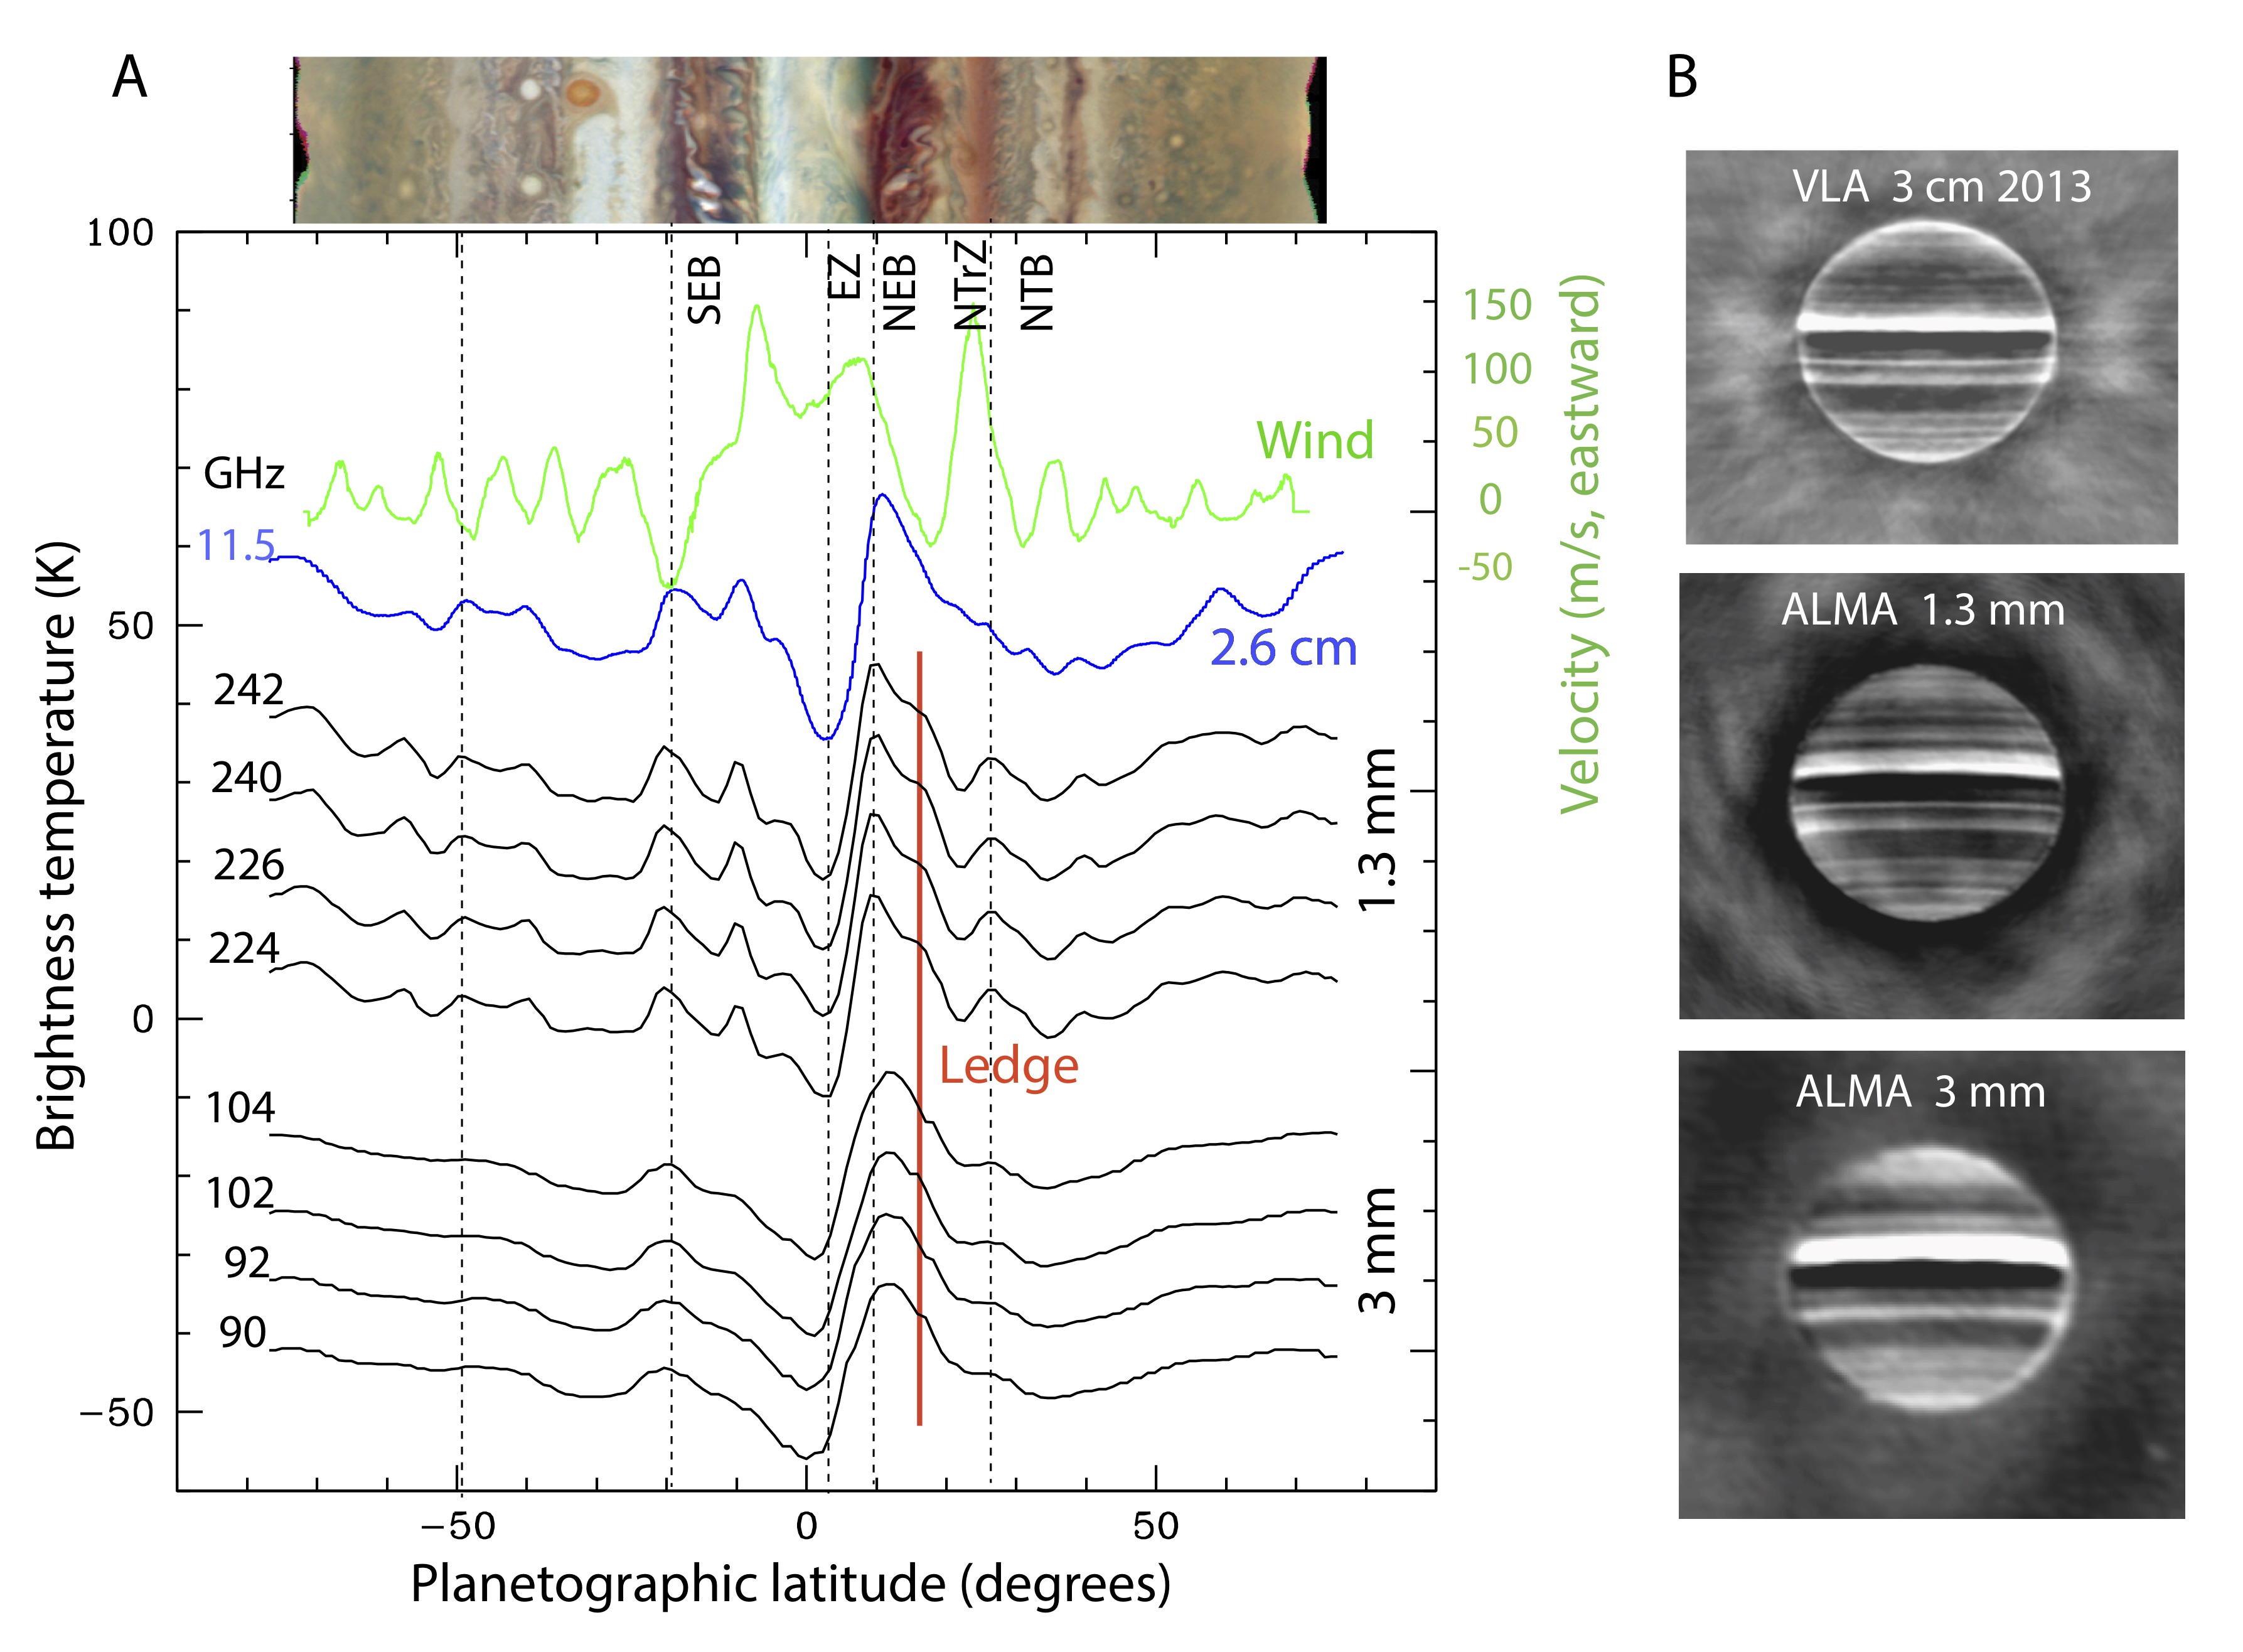
(A) North-south scans through longitude-smeared ALMA and VLA
maps. The scans were created by median averaging over 60deg of
longitude, centered on the central meridian of each map, after
reprojection on a longitude/latitude grid. Because a limb-darkened
disk had been subtracted from the data, the background level of each
scan is centered near 0 K, as for the 224 GHz scan. The scans are
offset for clarity by 10 K each, while each set is separated by 20
K. The spatial resolution of the 3 mm maps is about 2.5 times lower
than at 1.3 mm and the VLA maps, which lowers the feature
contrast. The vertical dashed lines (at, e.g., the EZ, SEB, NEB, and
NTB) help guide the eye to line up features. The green line at the
top is the (eastward) wind profile as measured from the HST data;
the scale is given on the right side. At the top, we show a slice
through the HST image from the Figure above. (B) Longitude-smeared
ALMA maps of Jupiter's thermal emission at 1.3 and 3 mm (averaged
over the entire Bands 6 and 3, respectively), and a VLA 3 cm map
from the paper highlighted in "Peering through Jupiter's clouds".
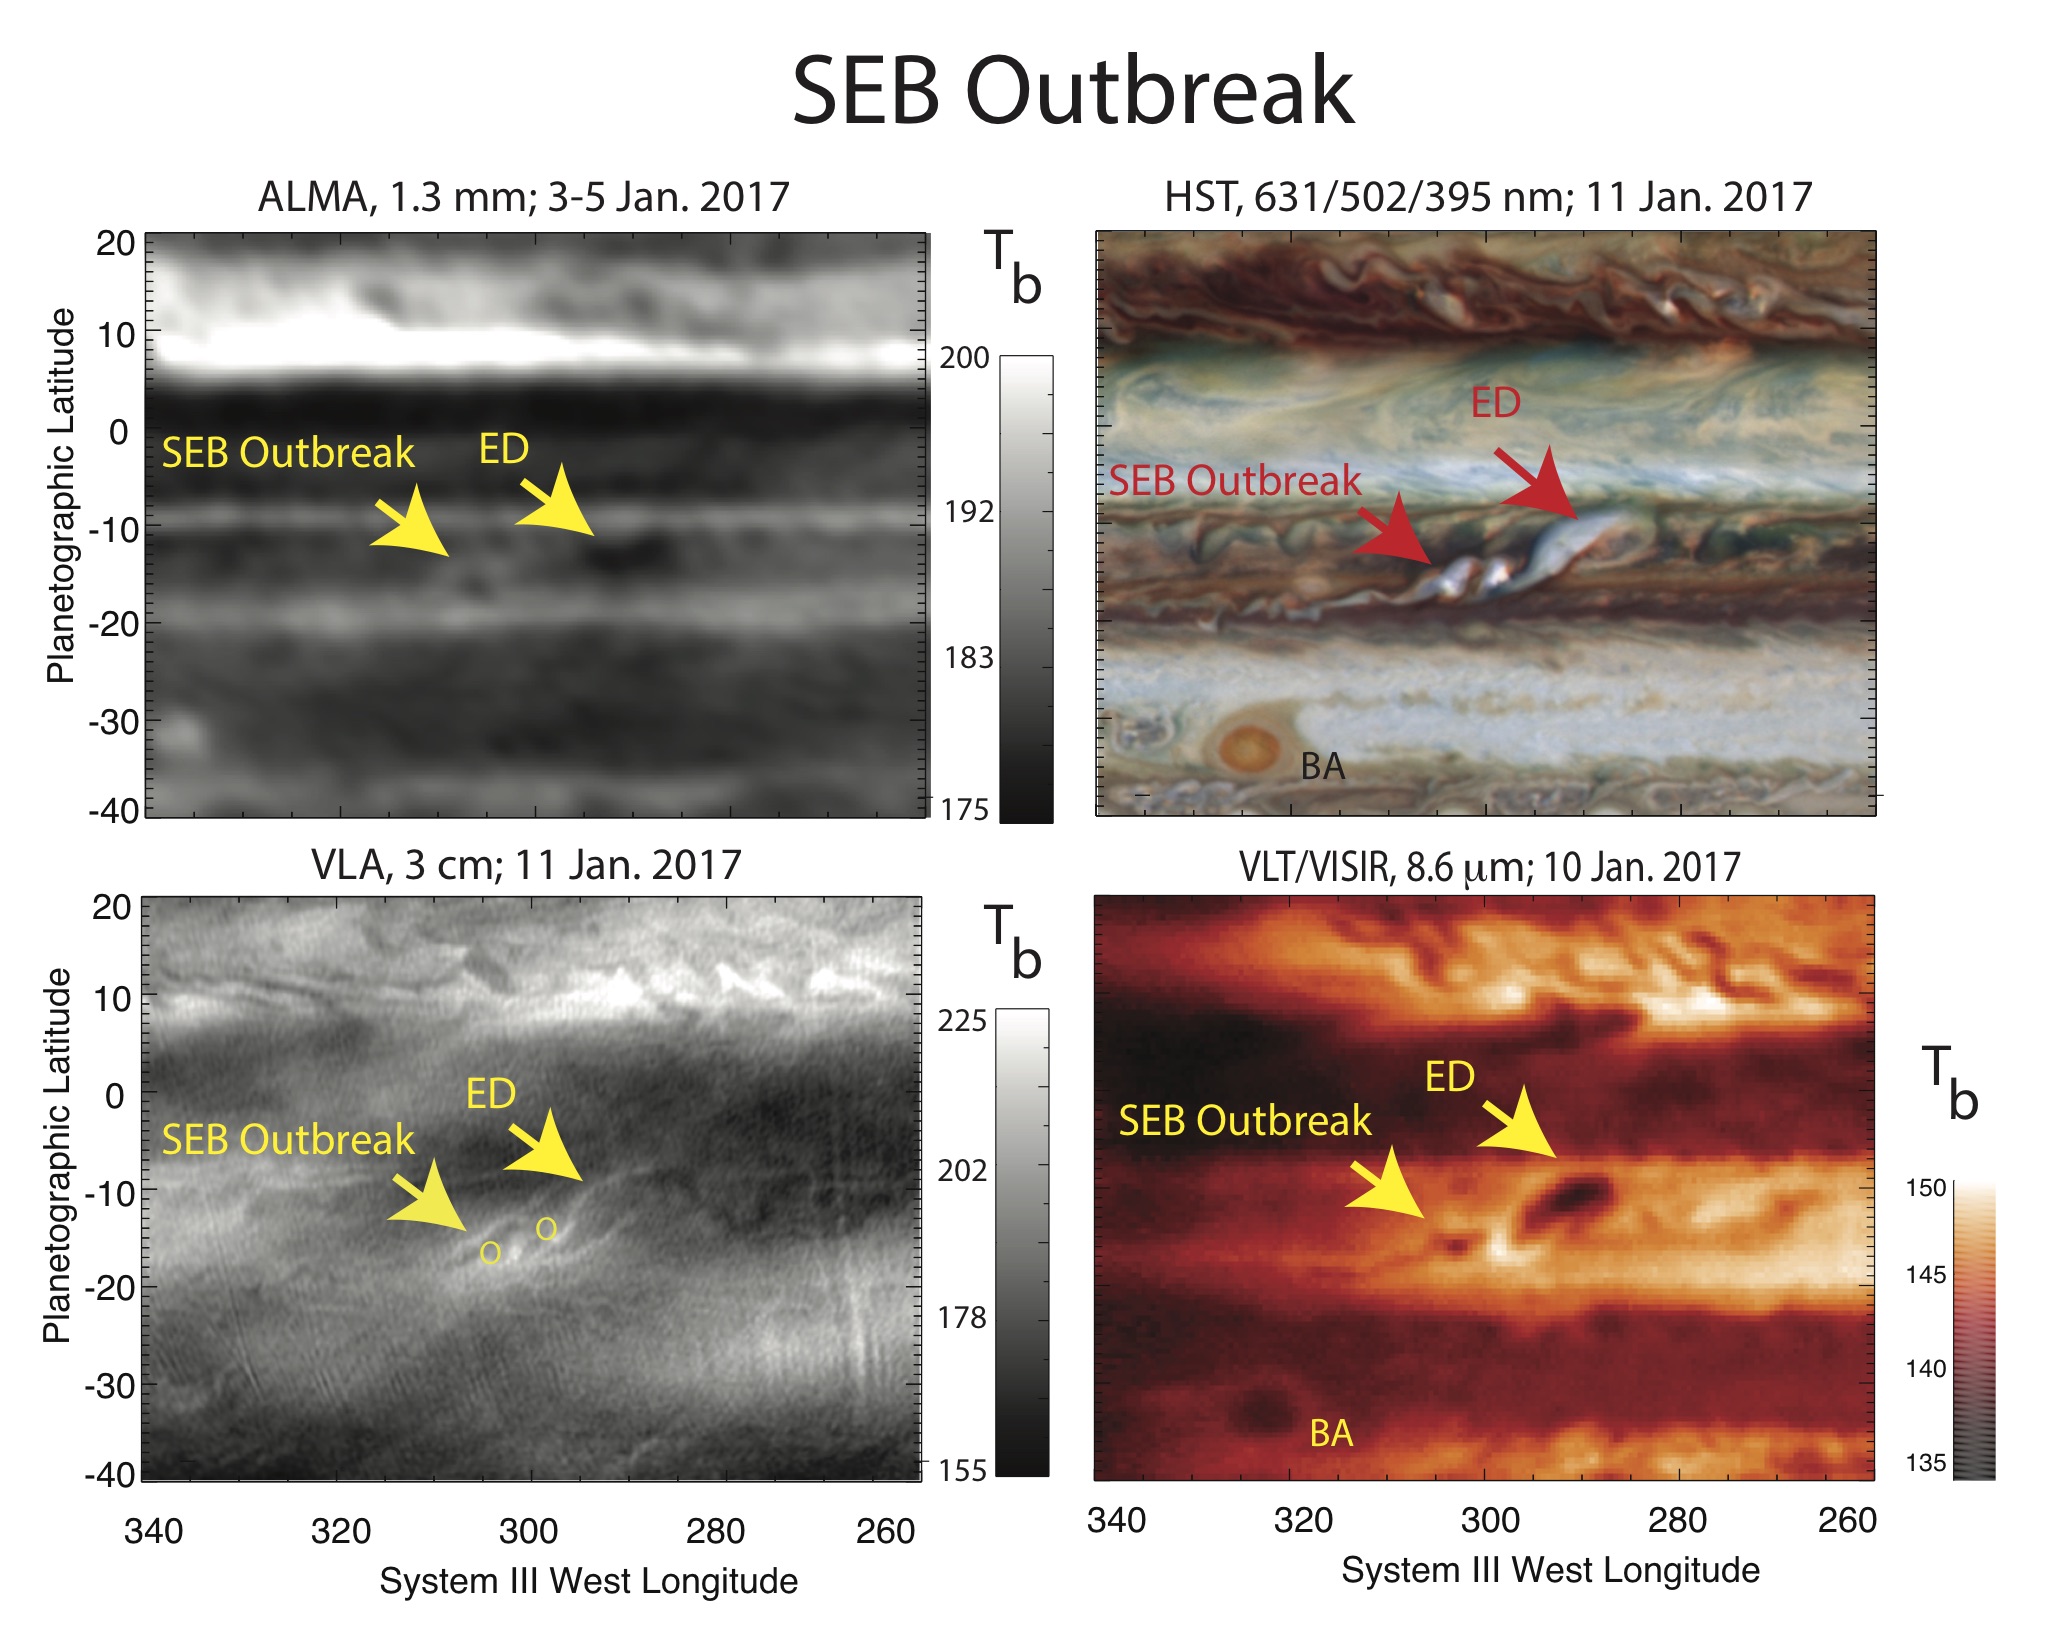
The SEB outbreak as observed at different wavelengths. Each panel is about 80deg in longitude and 60deg in latitude. The source of the outbreak, as well as the ED (East Disturbance), is indicated in several panels. The various wavelengths are sensitive to different gases and/or aerosols, and hence probe different depths (and hence different temperatures). The yellow circles on the VLA image indicate the location of the two bright plumes on the HST map.
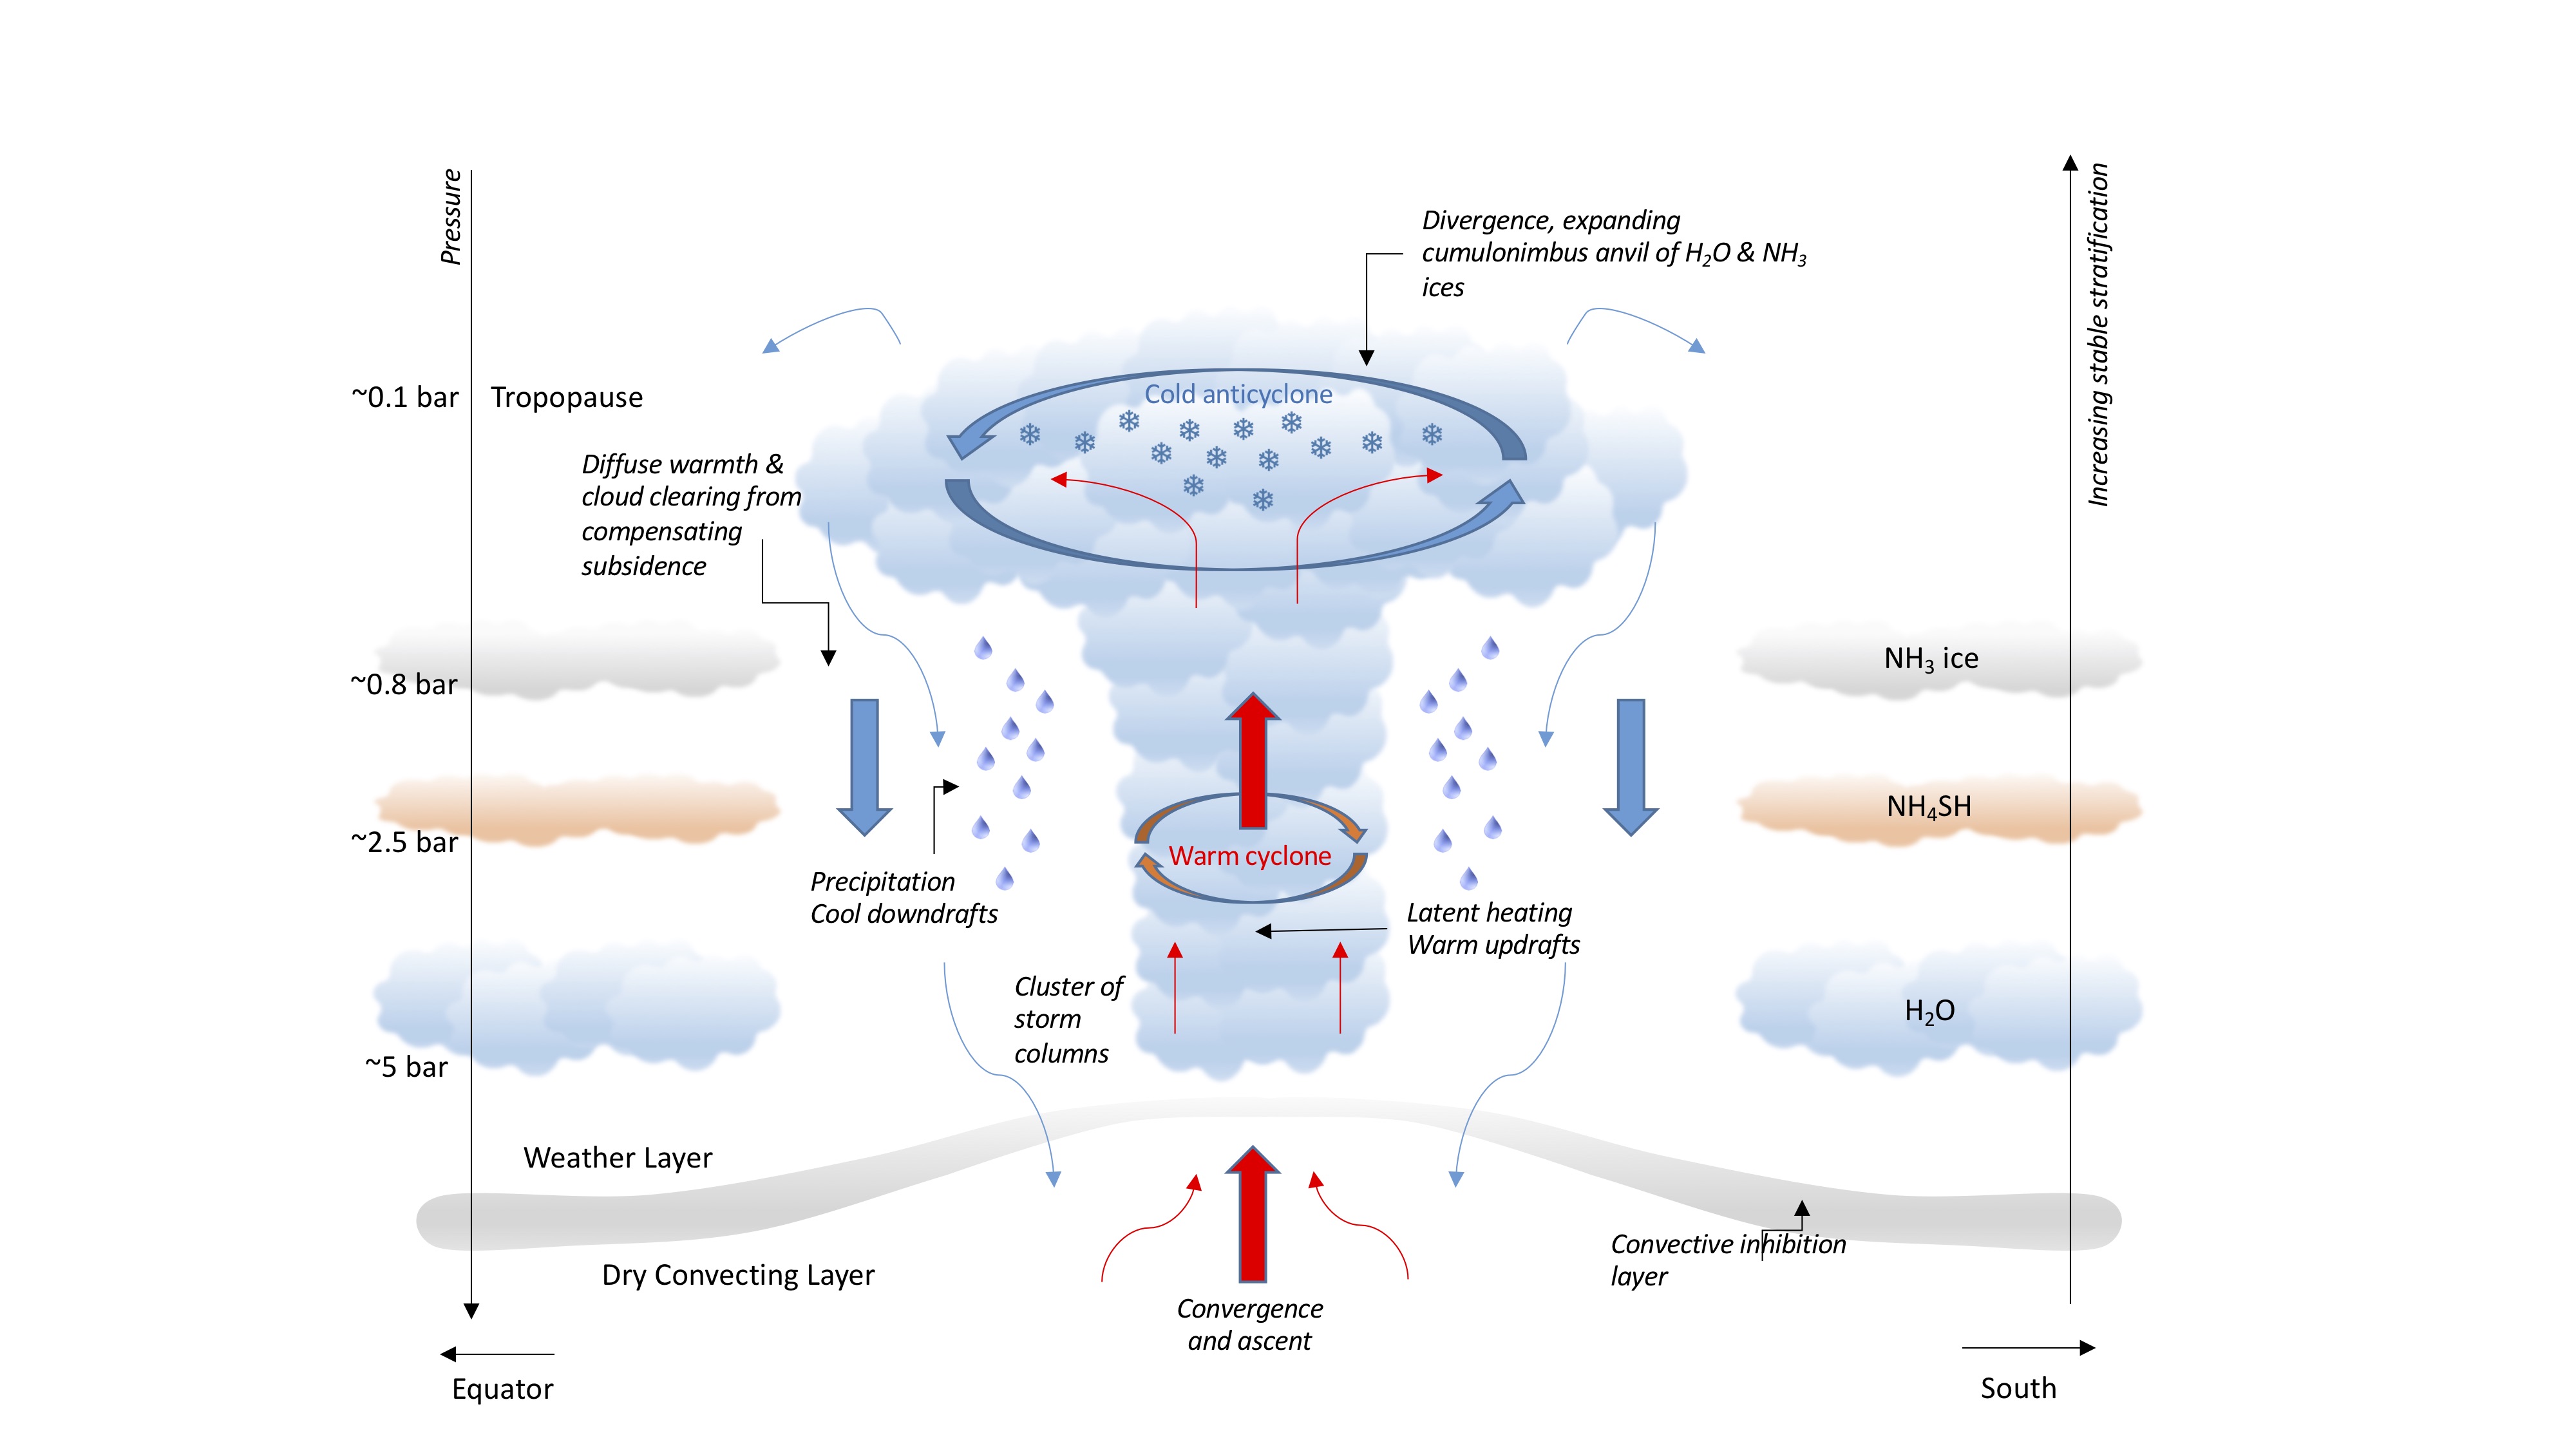
An illustration of "moist convection" in Jupiter's atmosphere shows a
rising plume originating about 80 km below the cloud tops, where the
pressure is five times that on Earth (5 bar), and rising through
regions where water condenses, ammonium hydrosulfide forms and
ammonia freezes out as ice, just below the coldest spot in the
atmosphere, the tropopause. (Adapted from an illustration by Leigh
Fletcher, University of Leicester; for more details, see Fletcher et
al., 2017, Icarus, 286, 94)
Back
to Prof. de Pater's Home Page