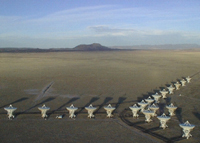

Karl G. Jansky Very Large Array (VLA)
Plains of San Augustin, west of Socorro, New Mexico
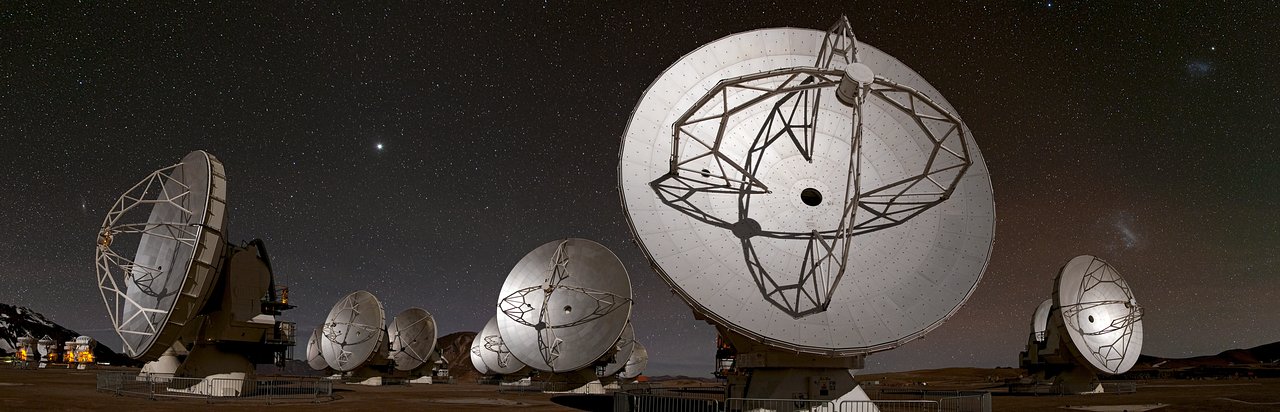
Atacama
Millimeter/submillimeter Array (ALMA)
Atacama Desert, Chile
Atacama Desert, Chile
|
|
|
|
|
Karl G. Jansky Very Large Array (VLA) Plains of San Augustin, west of Socorro, New Mexico |
Atacama
Millimeter/submillimeter Array (ALMA)
Atacama Desert, Chile |
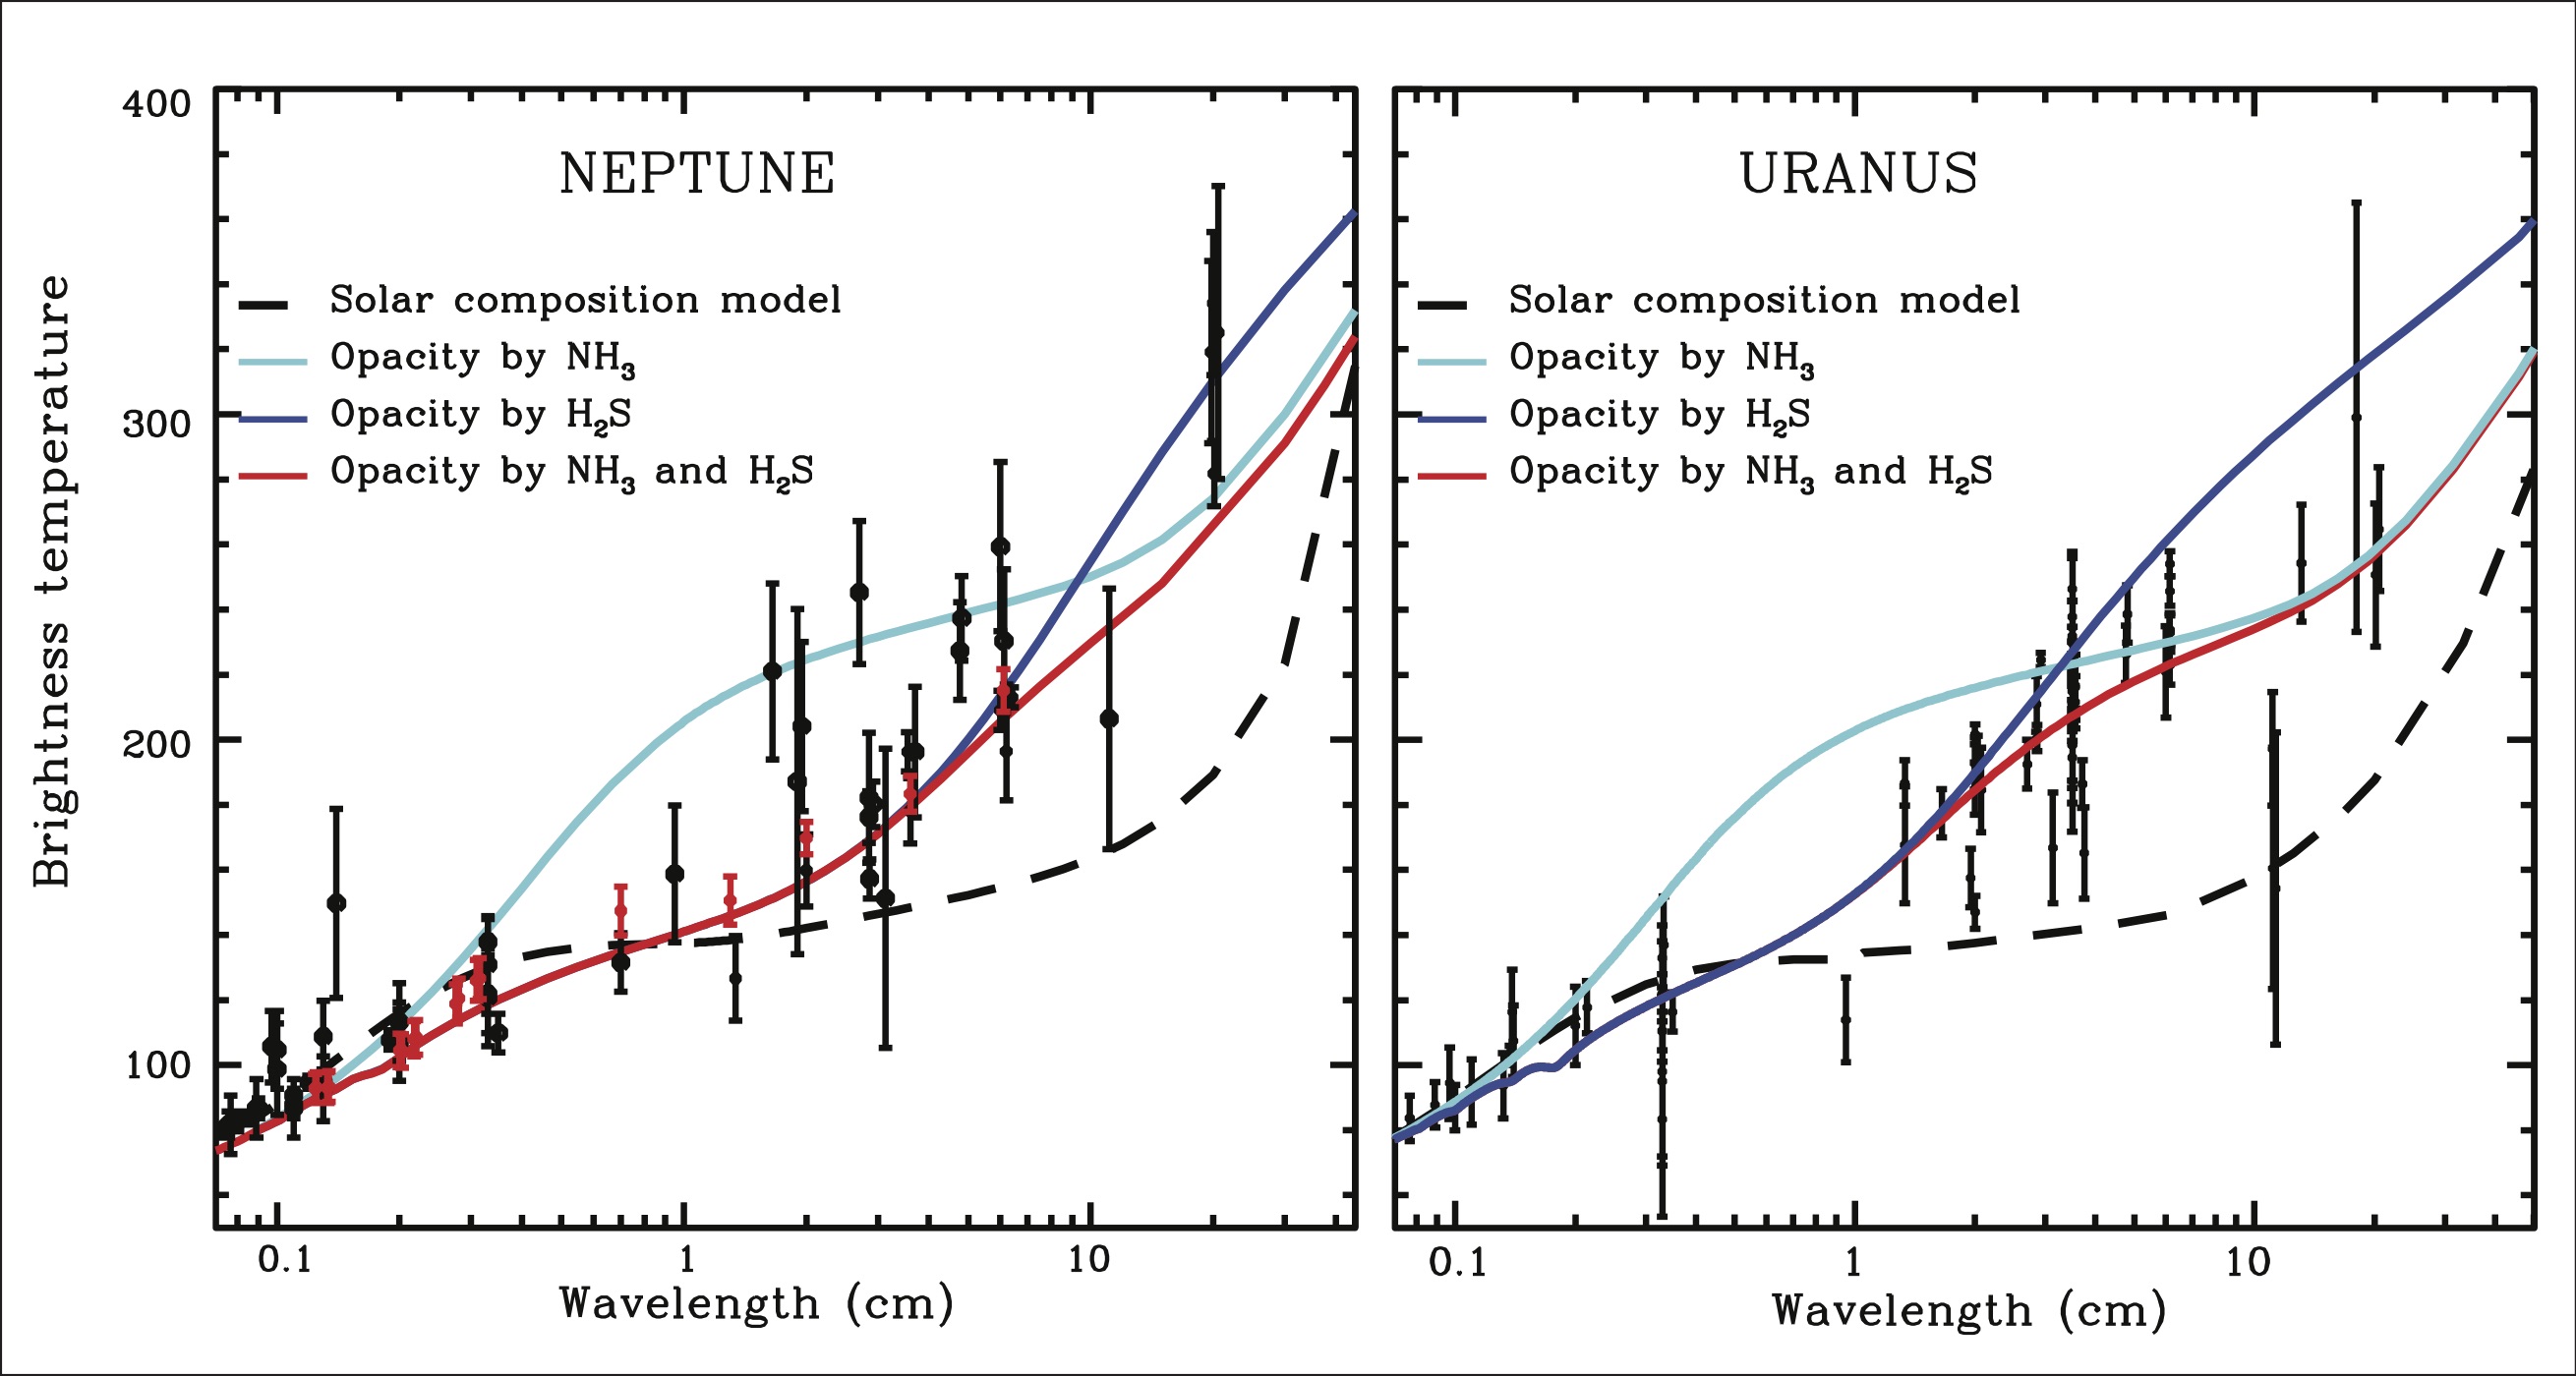
RADIO IMAGES AND SPECTRA OF NEPTUNE
Radio spectra of Uranus and Neptune are very similar, as shown above. For both planets we superimposed model calculations. The dashed line is a model with a composition that is approximately solar. The coloured lines are for models in which the abundances of H2O, H2S and CH4 in the planet's deep atmosphere are enhanced by a factor of 10 (Uranus) and 30 (Neptune) over the solar O, S and C values. Ammonia was kept at the solar N value and is therefore removed above the NH4SH cloud layer. The cyan line shows a calculation in which only opacity by NH3 (together with collision-induced opacity from hydrogen gas) is included. The dark blue curve shows the result when opacity from H2S is included and NH3 is ignored; the red curve has opacity from all gases included. (See: de Pater, I., 2018. Selective enrichment of volatiles confirmed. Nature Astronomy, 2, 364-365.; and de Pater, I., B. butler, R. J. Sault, A. Moullet, C. Moeckel, J. Tollefson, K. de Kleer, M. Gurwell, S. Milam, 2018. Potential for Solar System Science with the ngVLA. ASP Monograph Series: Science with a Next-Generation VLA, ed. E. J. Murphy (ASP, San Francisco, CA). pp. 49-72. eprint arXiv:1810.08521)
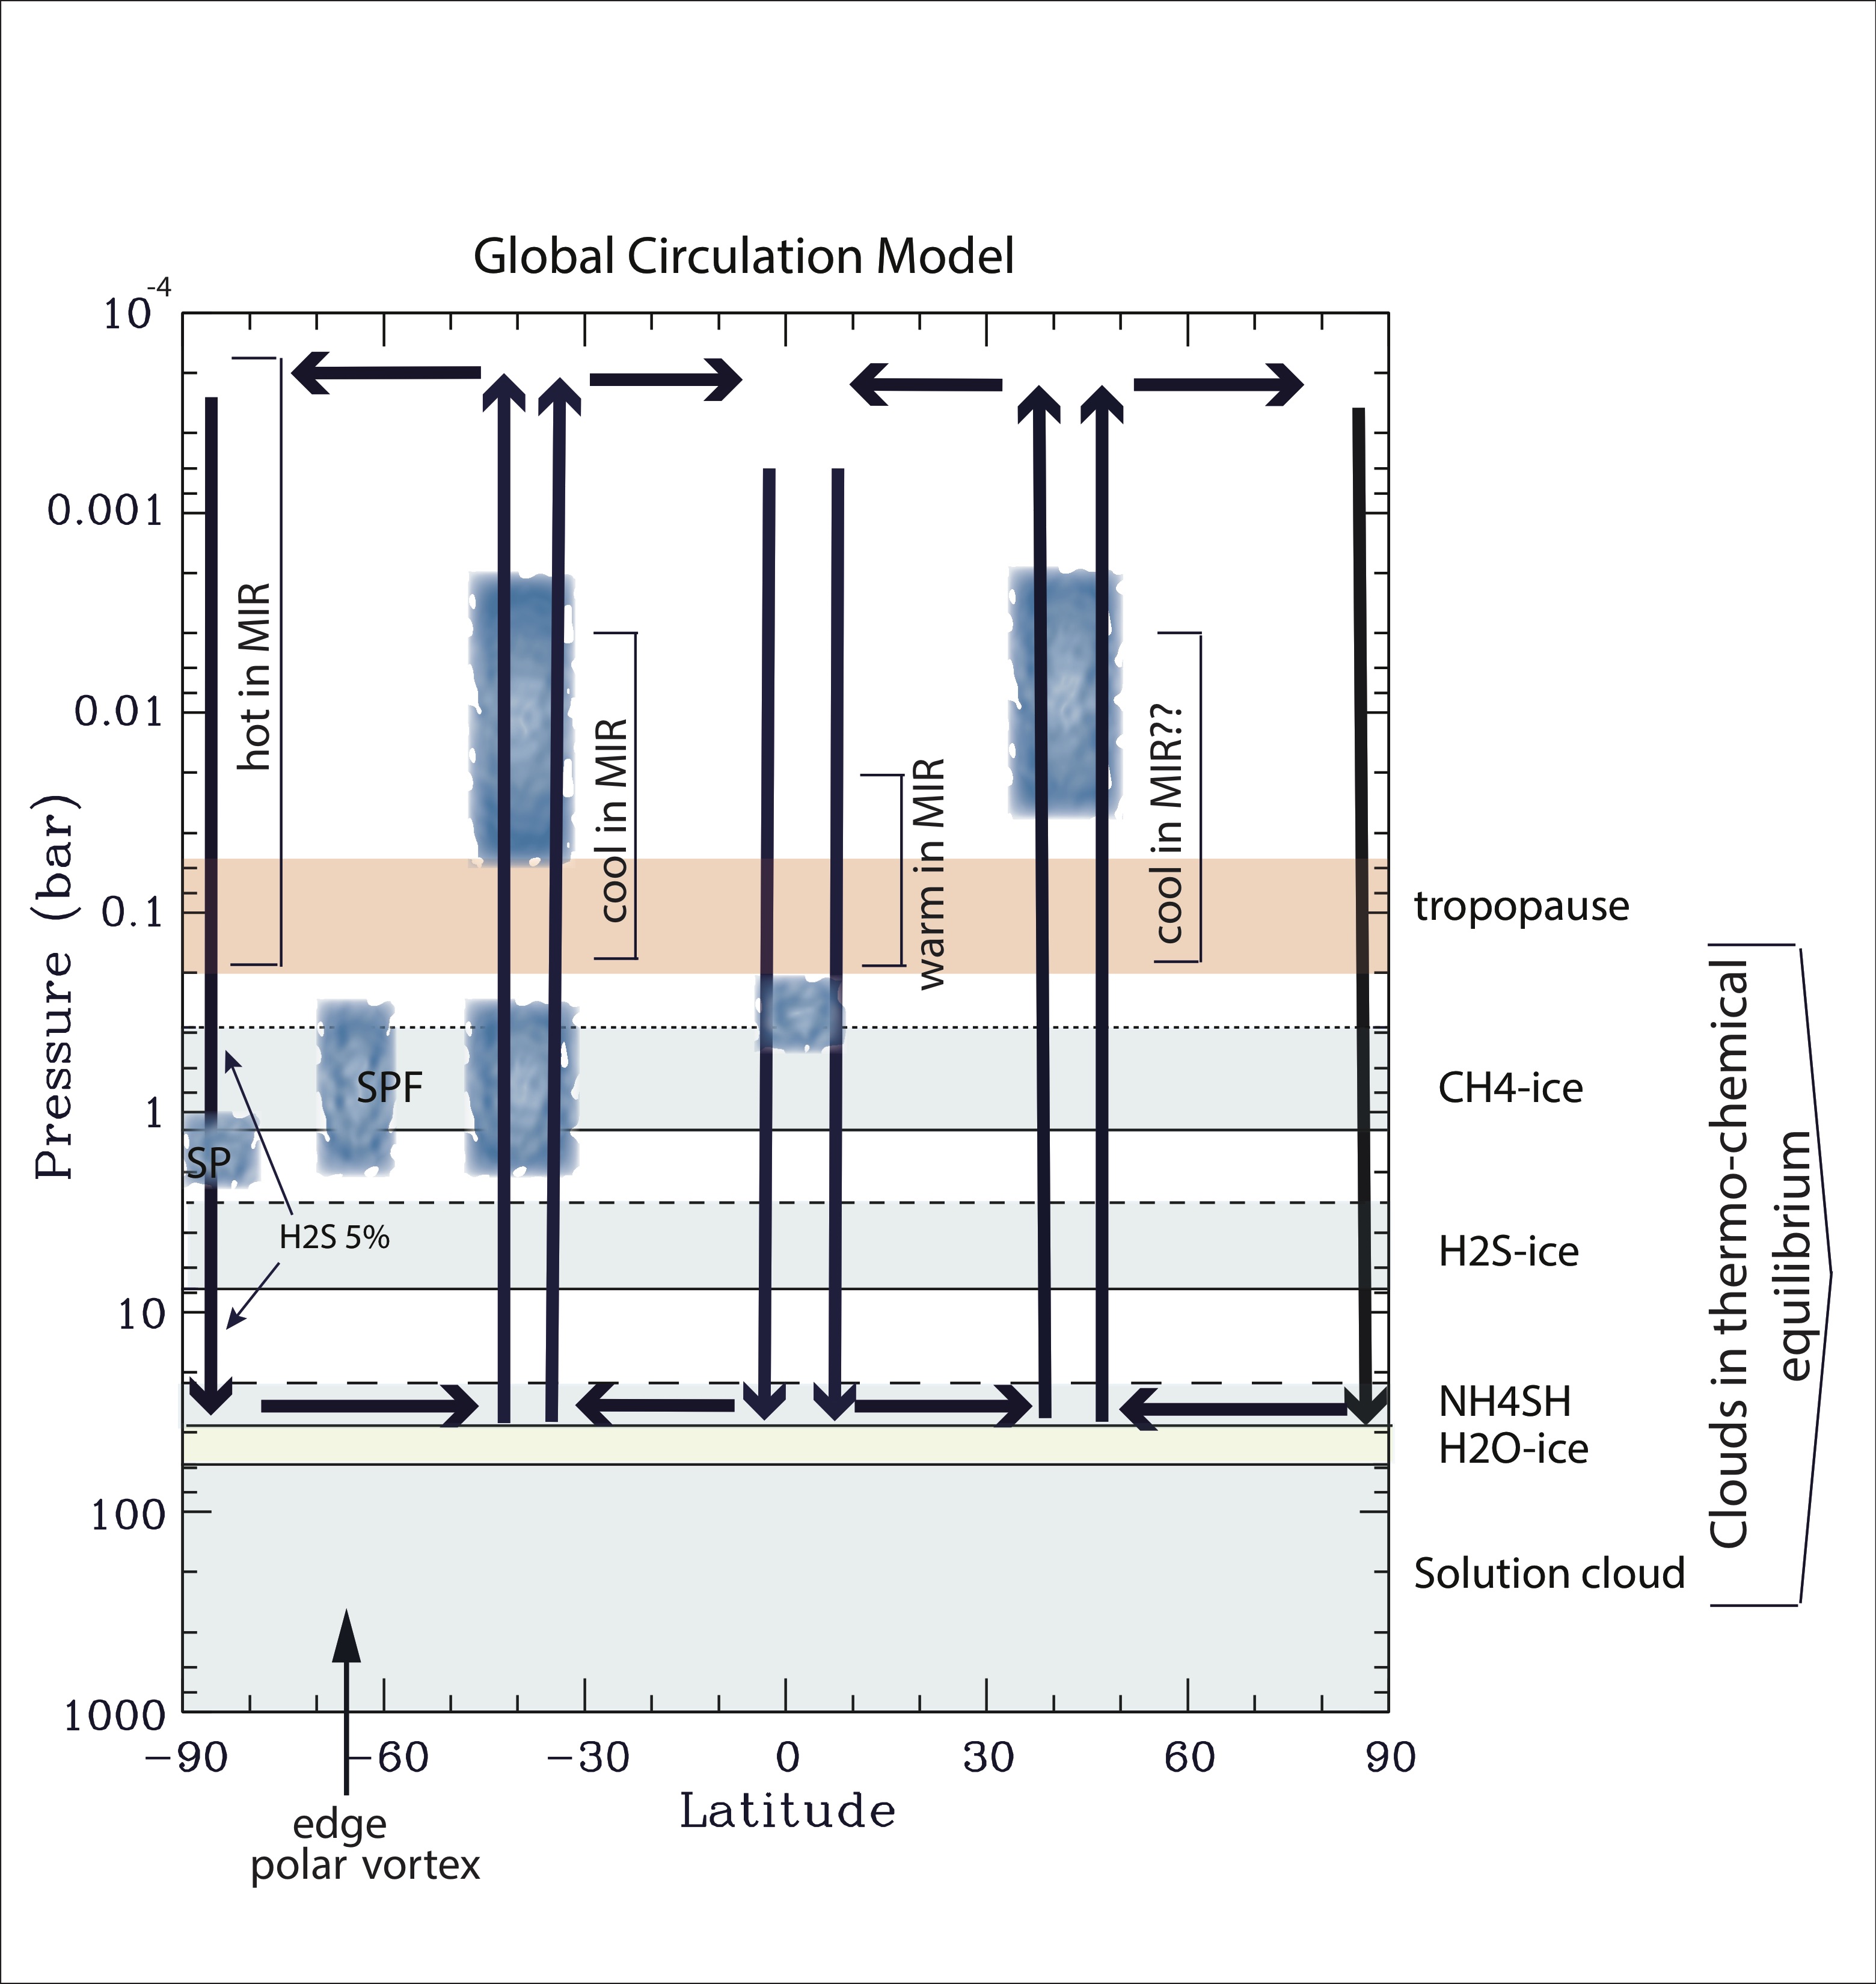
Multi-wavelength observations obtained in 2003 showed that Neptune's south pole is considerably enhanced in brightness at both mid-infrared and radio wavelengths, i.e., from ~0.1 mbar levels in the stratosphere down to tens of bars in the troposphere. The enhanced brightness observed at mid-infrared wavelengths is interpreted to be due to adiabatic heating by compression in the stratosphere, and the enhanced brightness temperature at radio wavelengths reveals that the subsiding air over the pole is very dry; at altitudes above the NH4SH cloud at ~40 bar it is only ~5% compared to that at deeper layers or other latitudes. This low humidity region extends from the south pole down to latitudes of 66 deg.S, the latitude of the planet's south polar prograde jet. Based upon the combination of near- and mid-IR and radio data, the authors suggested a global circulation pattern where air is rising above southern and northern midlatitudes, from the troposphere up well into the stratosphere, and subsidence of dry air over the pole and equator. Although this model is corroborated by more recent VLA data, as shown in the figure below, it does not explain all observations (see, e.g., (Tollefson et al. 2018)). Figure above from de Pater, I., L.N. Fletcher, S.H. Luszcz-Cook, D. DeBoer, B. Butler, H.B. Hammel, M.L. Sitko, G. Orton, P.S. Marcus, 2014. Neptune's Global Circulation deduced from Multi-Wavelength Observations. Icarus, 237, 211-238.
Longitude-smeared image of Neptune in Ku (2 cm; 12-18 GHz) band, taken in 2015. A uniform limb-darkened disk has been subtracted from the data. Brighter areas indicate higher brightness temperatures, likely caused by a low opacity (H2S gas), whereas darker areas indicate cold areas. Figure above from de Pater, I., B. butler, R. J. Sault, A. Moullet, C. Moeckel, J. Tollefson, K. de Kleer, M. Gurwell, S. Milam, 2018. Potential for Solar System Science with the ngVLA. ASP Monograph Series: Science with a Next-Generation VLA, ed. E. J. Murphy (ASP, San Francisco, CA). pp. 49-72. eprint arXiv:1810.08521)