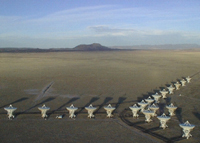

Karl G. Jansky Very Large Array (VLA)
Plains of San Augustin, west of Socorro, New Mexico
Atacama
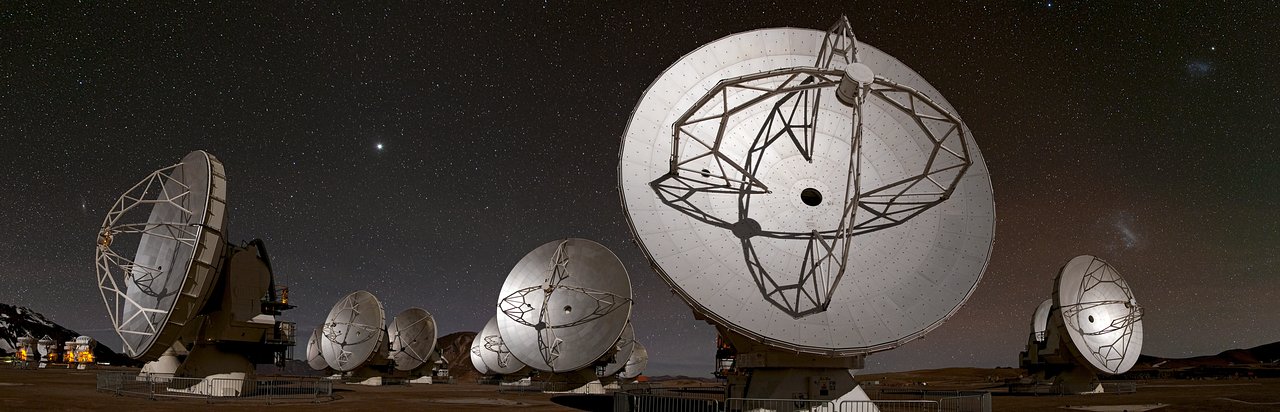
Millimeter/submillimeter Array (ALMA)
Atacama Desert, Chile
Atacama Desert, Chile
|
|
|
|
|
Karl G. Jansky Very Large Array (VLA) Plains of San Augustin, west of Socorro, New Mexico |
Atacama
Millimeter/submillimeter Array (ALMA)
Atacama Desert, Chile |
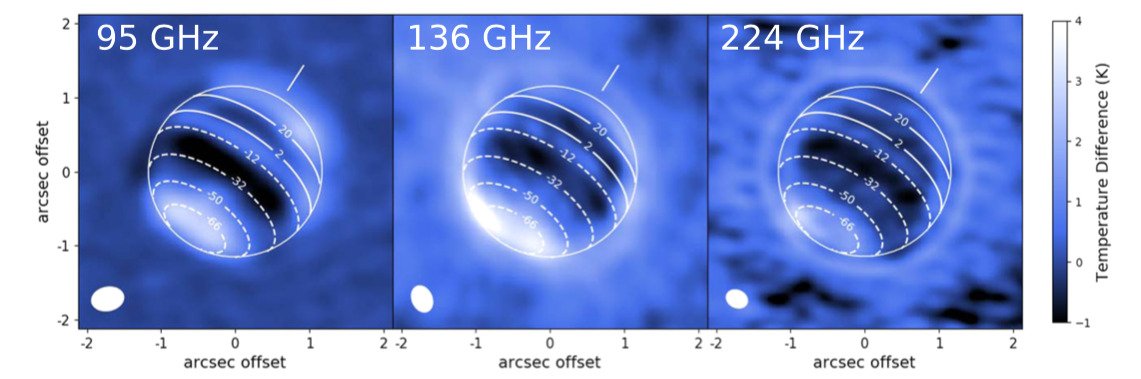
ALMA IMAGES OF NEPTUNE
ALMA (Atacama Large Millimeter/submillimeter Array) residual maps where the beam-convolved nominal model has been subtracted from the data. Contour lines delineate the latitude transitions between bands. Dark bands represent cold brightness temperatures relative to the model, while bright bands are warmer than the model. The FWHM of the beam is indicated in white in the bottom left of each map. The data were obtained in 2016-2017. The millimeter weighting functions peak between 1 and 10 bar on Neptune, lying in between the altitudes probed at visible/infrared and centimeter wavelengths. Thus, these observations provide important constraints on the atmospheric structure and dynamics of Neptune. From: Tollefson, J., de Pater, I., Luszcz-Cook, S., DeBoer, D., 2019. Neptune's Latitudinal Variations as Viewed with ALMA. Astron. J., 157, 251 (17pp). https://doi.org/10.3847/1538-3881/ab1fdf
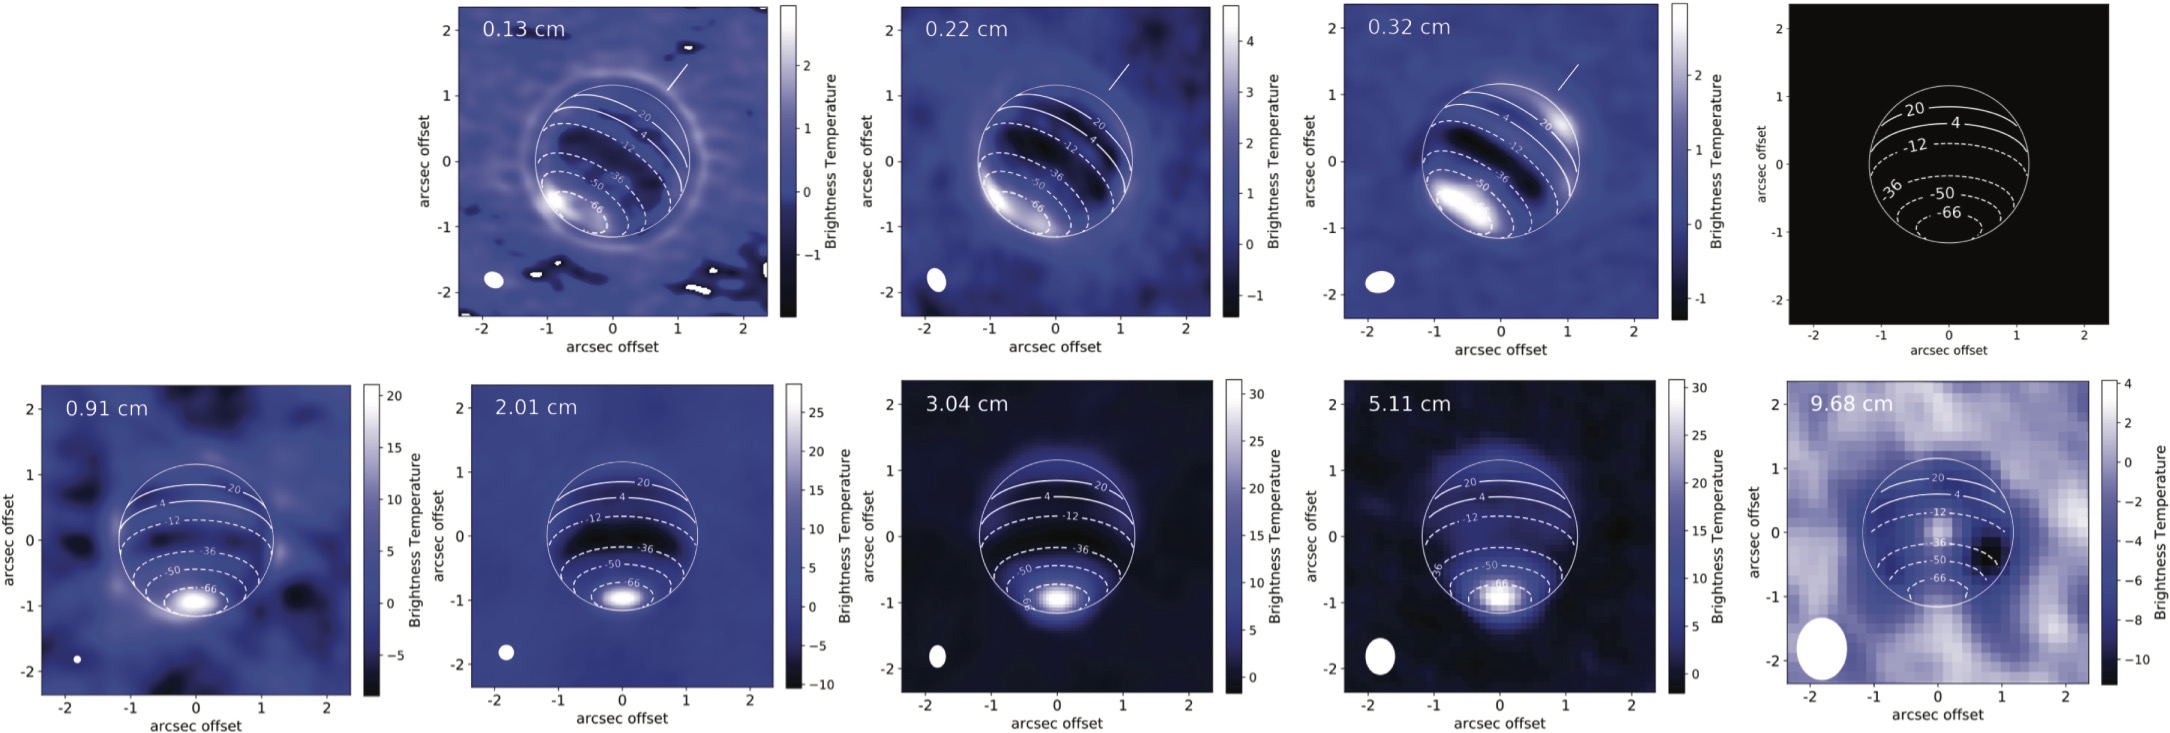
Longitude-smeared maps of Neptune taken with ALMA (top row) and the upgraded VLA (bottom row). The color scale has been chosen to enhance the brightness contrasts across the disk. All maps are residuals, where a uniform limb-darkened model has been subtracted to highlight the temperature contrasts between latitudes. The north pole is indicated by a white line in the ALMA maps; the VLA maps are rotated so that the north pole is pointing upward. Contour lines delineate the latitude transitions between bands, with a grid over a blank disk shown in the upper right for clarity. Neptune's disk is outlined with a white ellipse. The FWHM of the beam is indicated in white in the bottom left of each map. Fom: Tollefson, J., de Pater, I., Molter, E.M., Sault, R.J., Butler, B.J., Luszcz-Cook, S., DeBoer, D.: Neptune's Spatial Brightness Temperature Variations from the VLA and ALMA. 2021, PSJ 2, 105, [arXiv:astro-ph.EP/2104.06554]. doi:10.3847/PSJ/abf837.
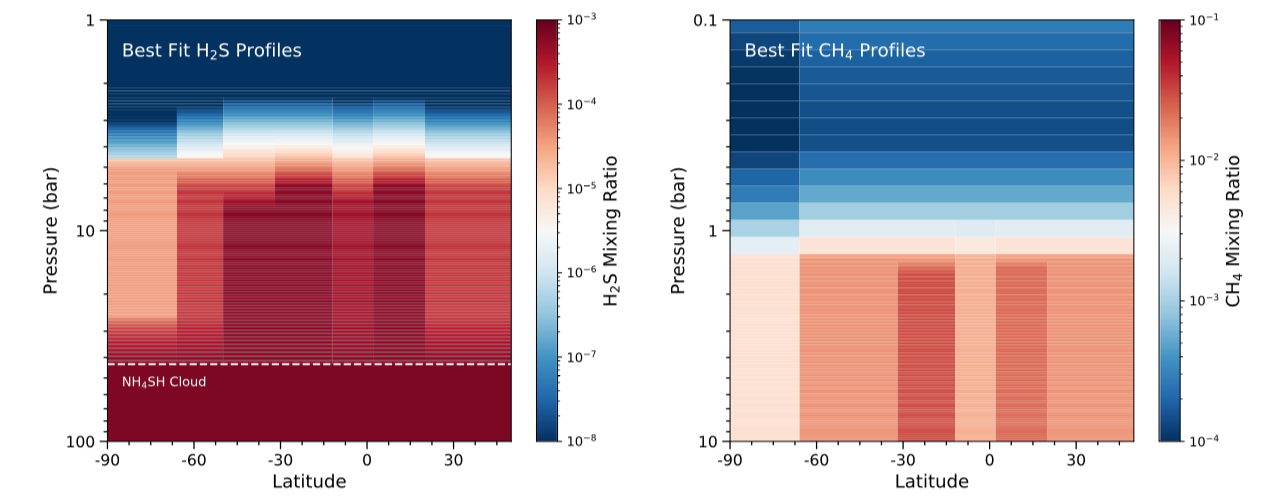
Left: best-fit H2S vertical profiles vs. latitude based upon the ALMA data shown above. Right: best-fit CH4 vertical profiles vs. latitude. The colors represent volume mixing ratios, with high abundances in red and low abundances in blue. Note the different pressure and mixing ratio scales between the two figures. From: Tollefson, J., de Pater, I., Luszcz-Cook, S., DeBoer, D., 2019. Neptune's Latitudinal Variations as Viewed with ALMA. Astron. J., 157, 251 (17pp). https://doi.org/10.3847/1538-3881/ab1fdf