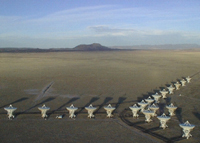

Karl G. Jansky Very Large Array (VLA)
Plains of San Augustin, west of Socorro, New Mexico
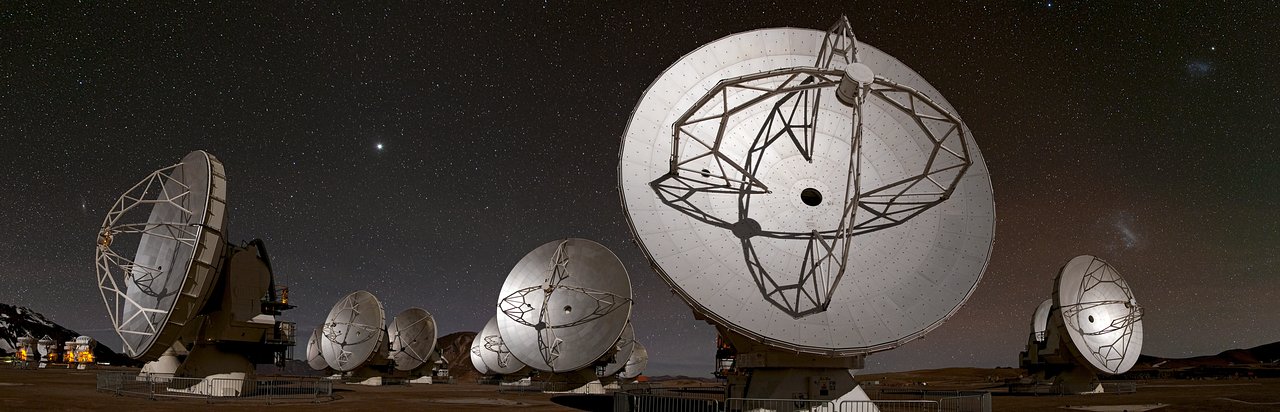
Atacama
Millimeter/submillimeter Array (ALMA)
Atacama Desert, Chile
Atacama Desert, Chile
|
|
|
|
|
Karl G. Jansky Very Large Array (VLA) Plains of San Augustin, west of Socorro, New Mexico |
Atacama
Millimeter/submillimeter Array (ALMA)
Atacama Desert, Chile |
VLA RADIO MAPS OF SATURN SHOW LONG-LASTING DEEP EFFECT OF SATURN'S GIANT STORMS
Planetary-scale giant storms erupt on Saturn every 20-30 years. There have been at least six recorded occurrences of past eruptions and the most recent one was in 2010. We used the Very Large Array in 2015 to probe the deep response of Saturn's troposphere to the giant storms. In addition to the remnant effect of the storm in 2010, we have found long-lasting signatures of all giant storms, up to hundreds of years old. We derive an ammonia anomaly map that shows an extended meridional migration of the storm's aftermath and vertical transport of ammonia vapor by storm dynamics. This research is published in: Li, Cheng, de Pater, Imke, Moeckel, C.M., Sault, R.J., Butler, B., deBoer, D., Zhang, Z., 2023. Long-lasting, deep effect of Saturn's Giant Storms. Science Advances, . DOI:10.1126/sciadv.adg9419
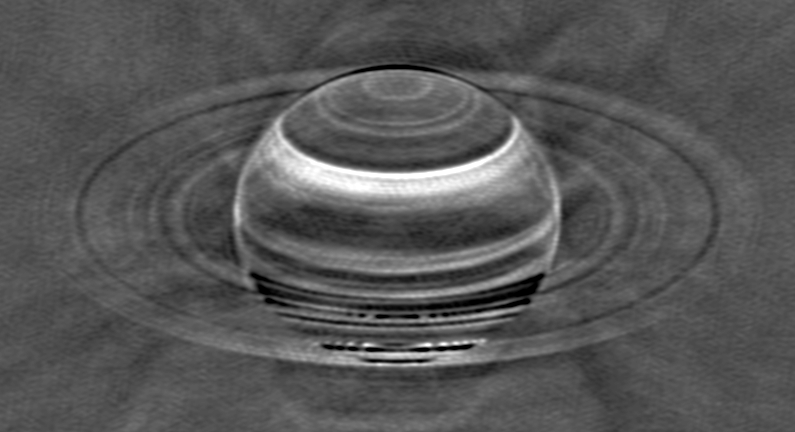
Radio image of Saturn taken with the VLA in May 2015 after combining data at 2 and 3.5 cm. A uniform wavelength-dependent limb-darkened model of the disk and a best-fit model of Saturn's rings had been subtracted before creating this image. Bright features indicate a high brightness temperature, presumably caused by being able to probe deeper warmer layers due to a lower opacity (clearer atmosphere) in these regions. The broad bright band at northern latitudes is the aftermath of the 2010 storm on Saturn. The storm has depleted ammonia gas just below the ammonia-ice cloud, which is the cloud you see with your eyes when viewing Saturn. Since ammonia gas is the main source of opacity at radio wavelengths, we probe deeper warmer layers in Saturn's atmosphere at that latitude (near 40 deg. N), making Saturn appear bright here. (Courtesy: R. J. Sault and Imke de Pater).
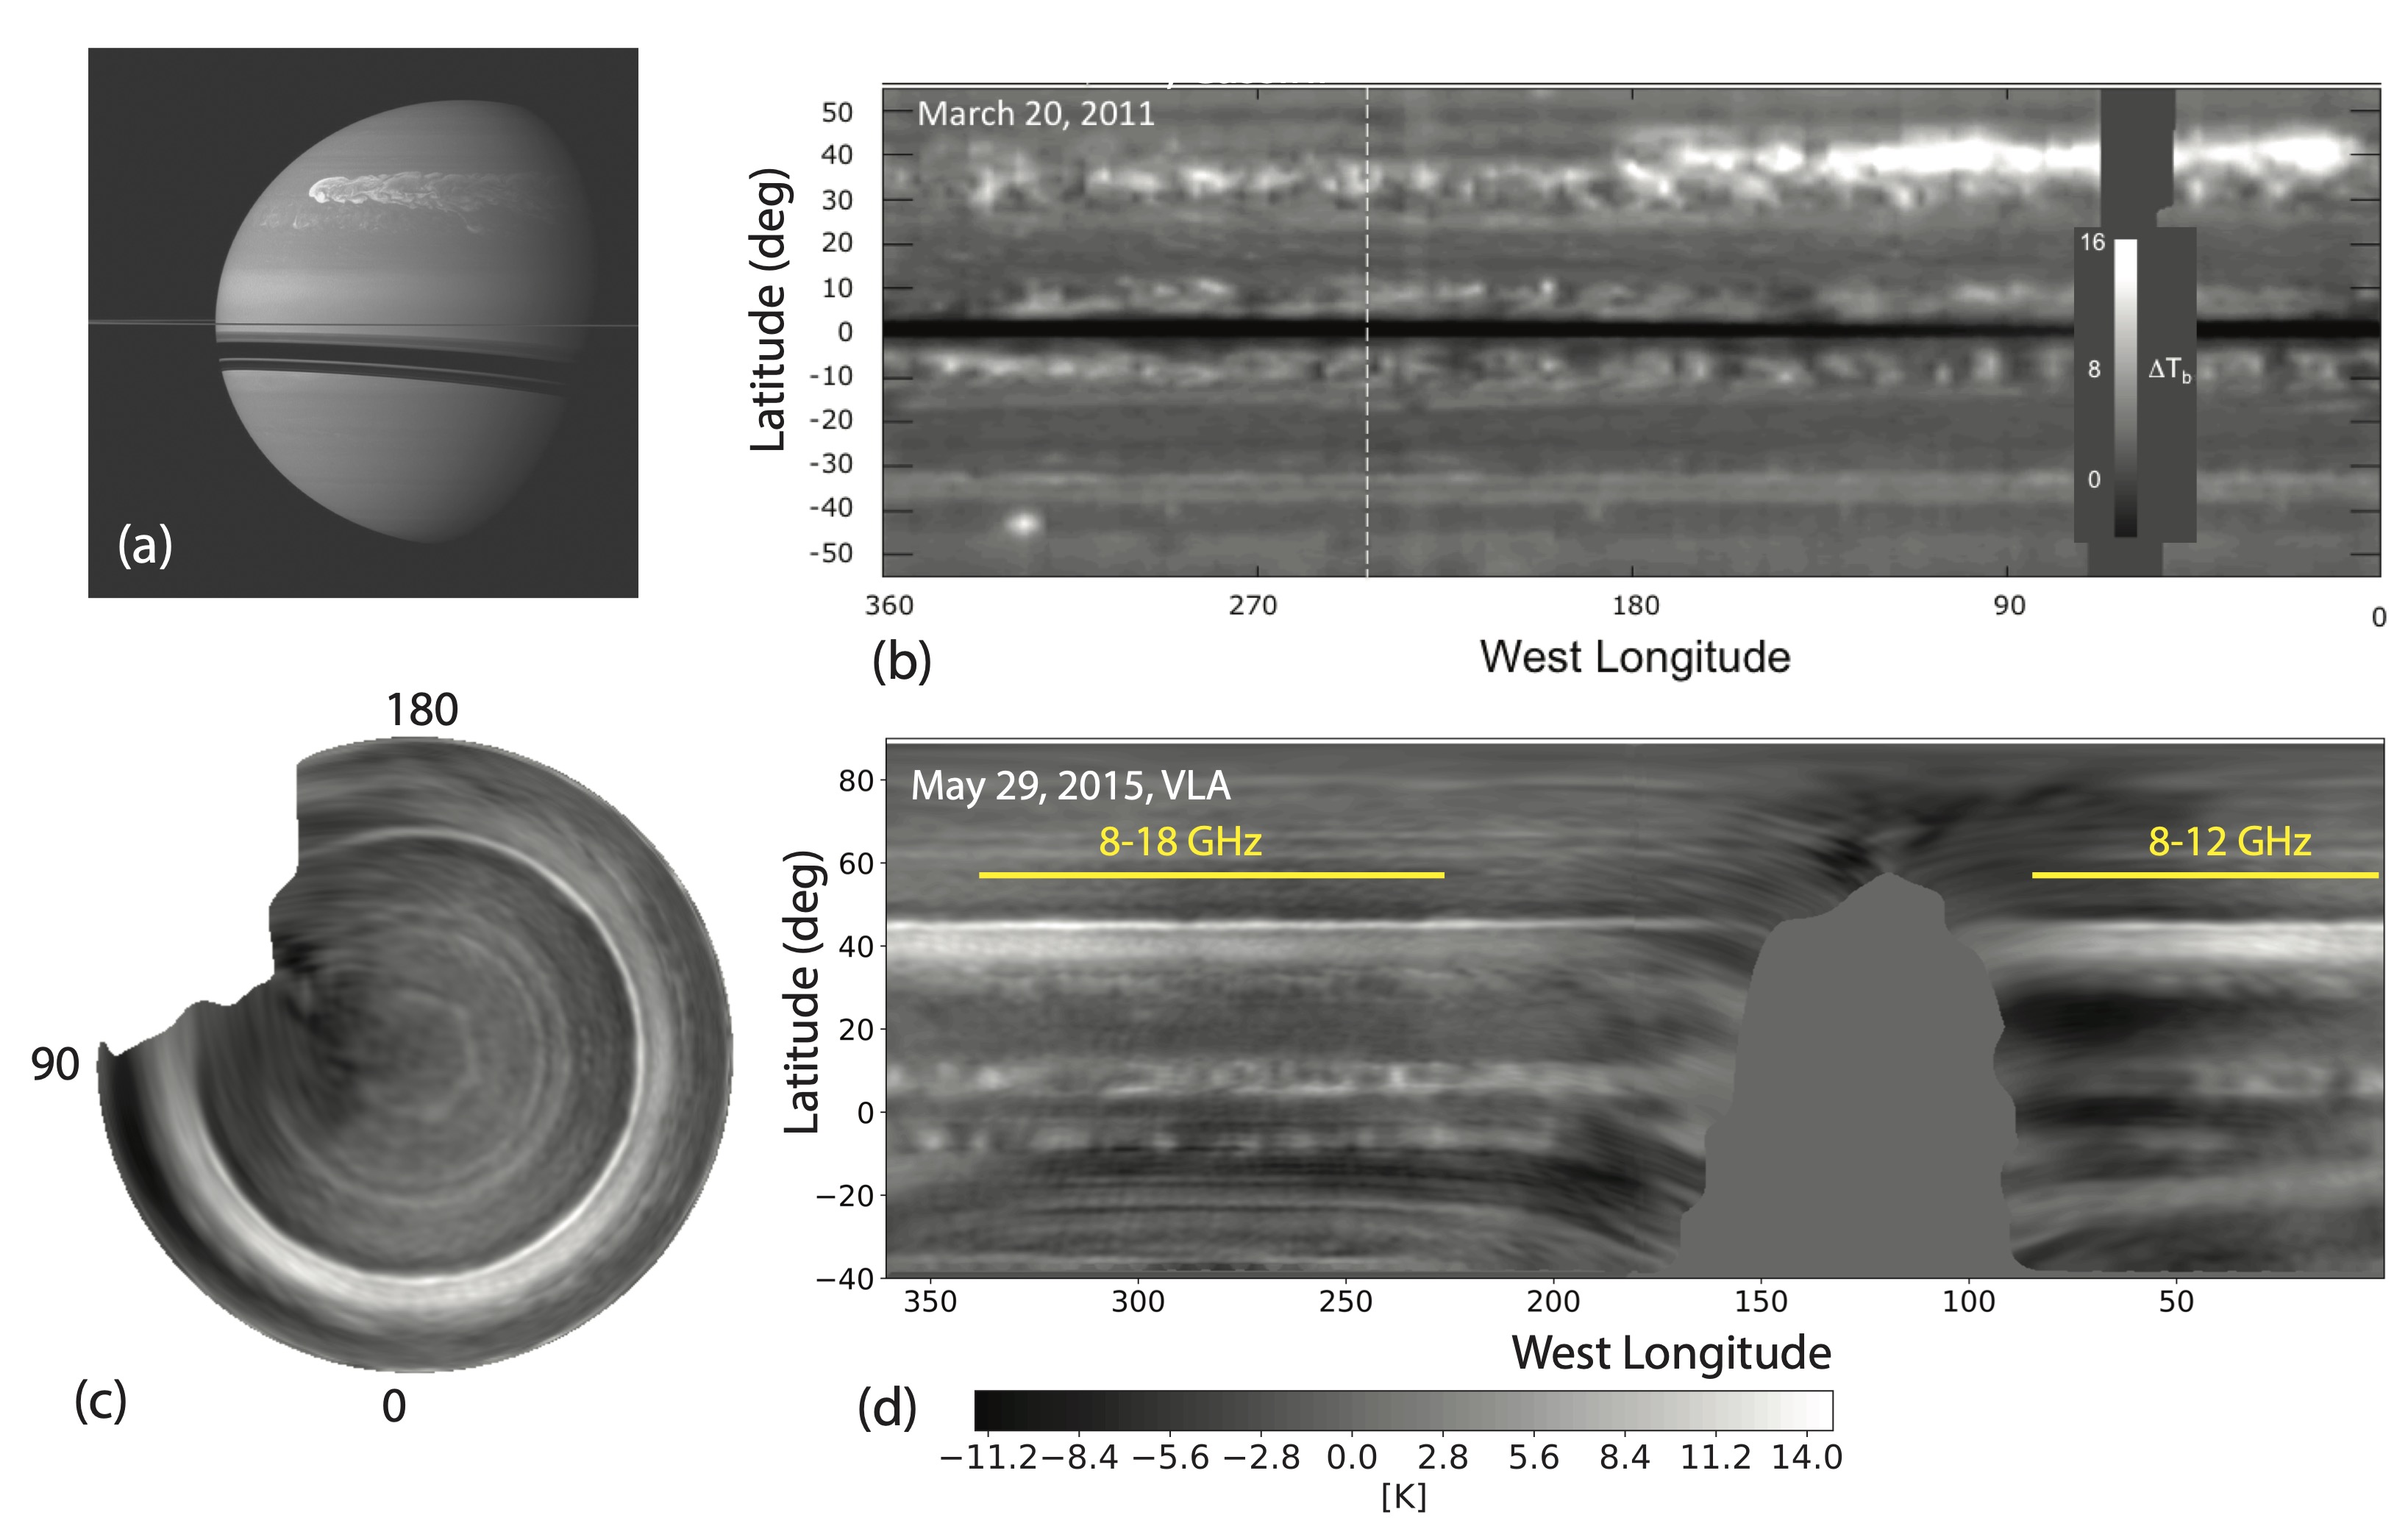
(a) Image of Saturn taken by the Cassini spacecraft on 25 February 2011, about 12 weeks after a powerful storm was first detected in Saturn's northern hemisphere. This storm is seen overtaking itself as it encircles the entire planet. (NASA/JPL/Space Science Institute, PIA12826). (b) Cylindrical map of Saturn's 2-cm brightness temperature constructed from Cassini radiometer observations taken in March 2011. The residual brightness is shown relative to a model for a fully saturated atmosphere. The black stripe across the equator is Saturn's ring, which blocks the planet's thermal radiation. The planet was mapped by continuous pole-to-pole scans during 14 hrs when the spacecraft was near periapse. Periapse (indicated by the dashed line) was at 3.72 Saturn radii, where the spatial resolution was best (1.6 deg in latitude). The effect of the 2010 storm is seen near 40 deg N, between about 0 and 180 deg W. longitude. The storm has dried out the atmosphere (ammonia), so deeper warmer layers are probed. (Janssen, M.A. et al., 2013. Saturn's thermal emission at 2.2-cm wavelength as imaged by the Cassini RADAR radiometer. Icarus 2013, 226, 522-535.) (c) Polar projection of Saturn's radio map in panel d (i.e., 3- and 2-cm bands combined), revealing the hexagon at its north pole. (d) VLA longitude resolved map from 29 May 2015, after subtraction of a uniform limb-darkened disk and a best-fit model of Saturn's rings (ring residuals are apparent in the southern hemisphere). Bright features indicate a high brightness temperature. Observations at 3-cm (8-12 GHz) and 2-cm (12-18 GHz) bands are combined; together they cover almost a full rotation of the planet. The aftermath of the 2010 storm is still visible near 40 deg N latitude, across all longitudes. (panels c, d: Courtesy: R. J. Sault and Imke de Pater; see also: de Pater, I, Molter, E.M., Moeckel, C.M., 2023. A Review of Radio Observations of the Giant Planets: Probing the Composition, Structure and Dynamics of their Deep Atmospheres. Remote Sensing, Vol. 15, 1313, pp49. https://doi.org/10.3390/rs15051313)
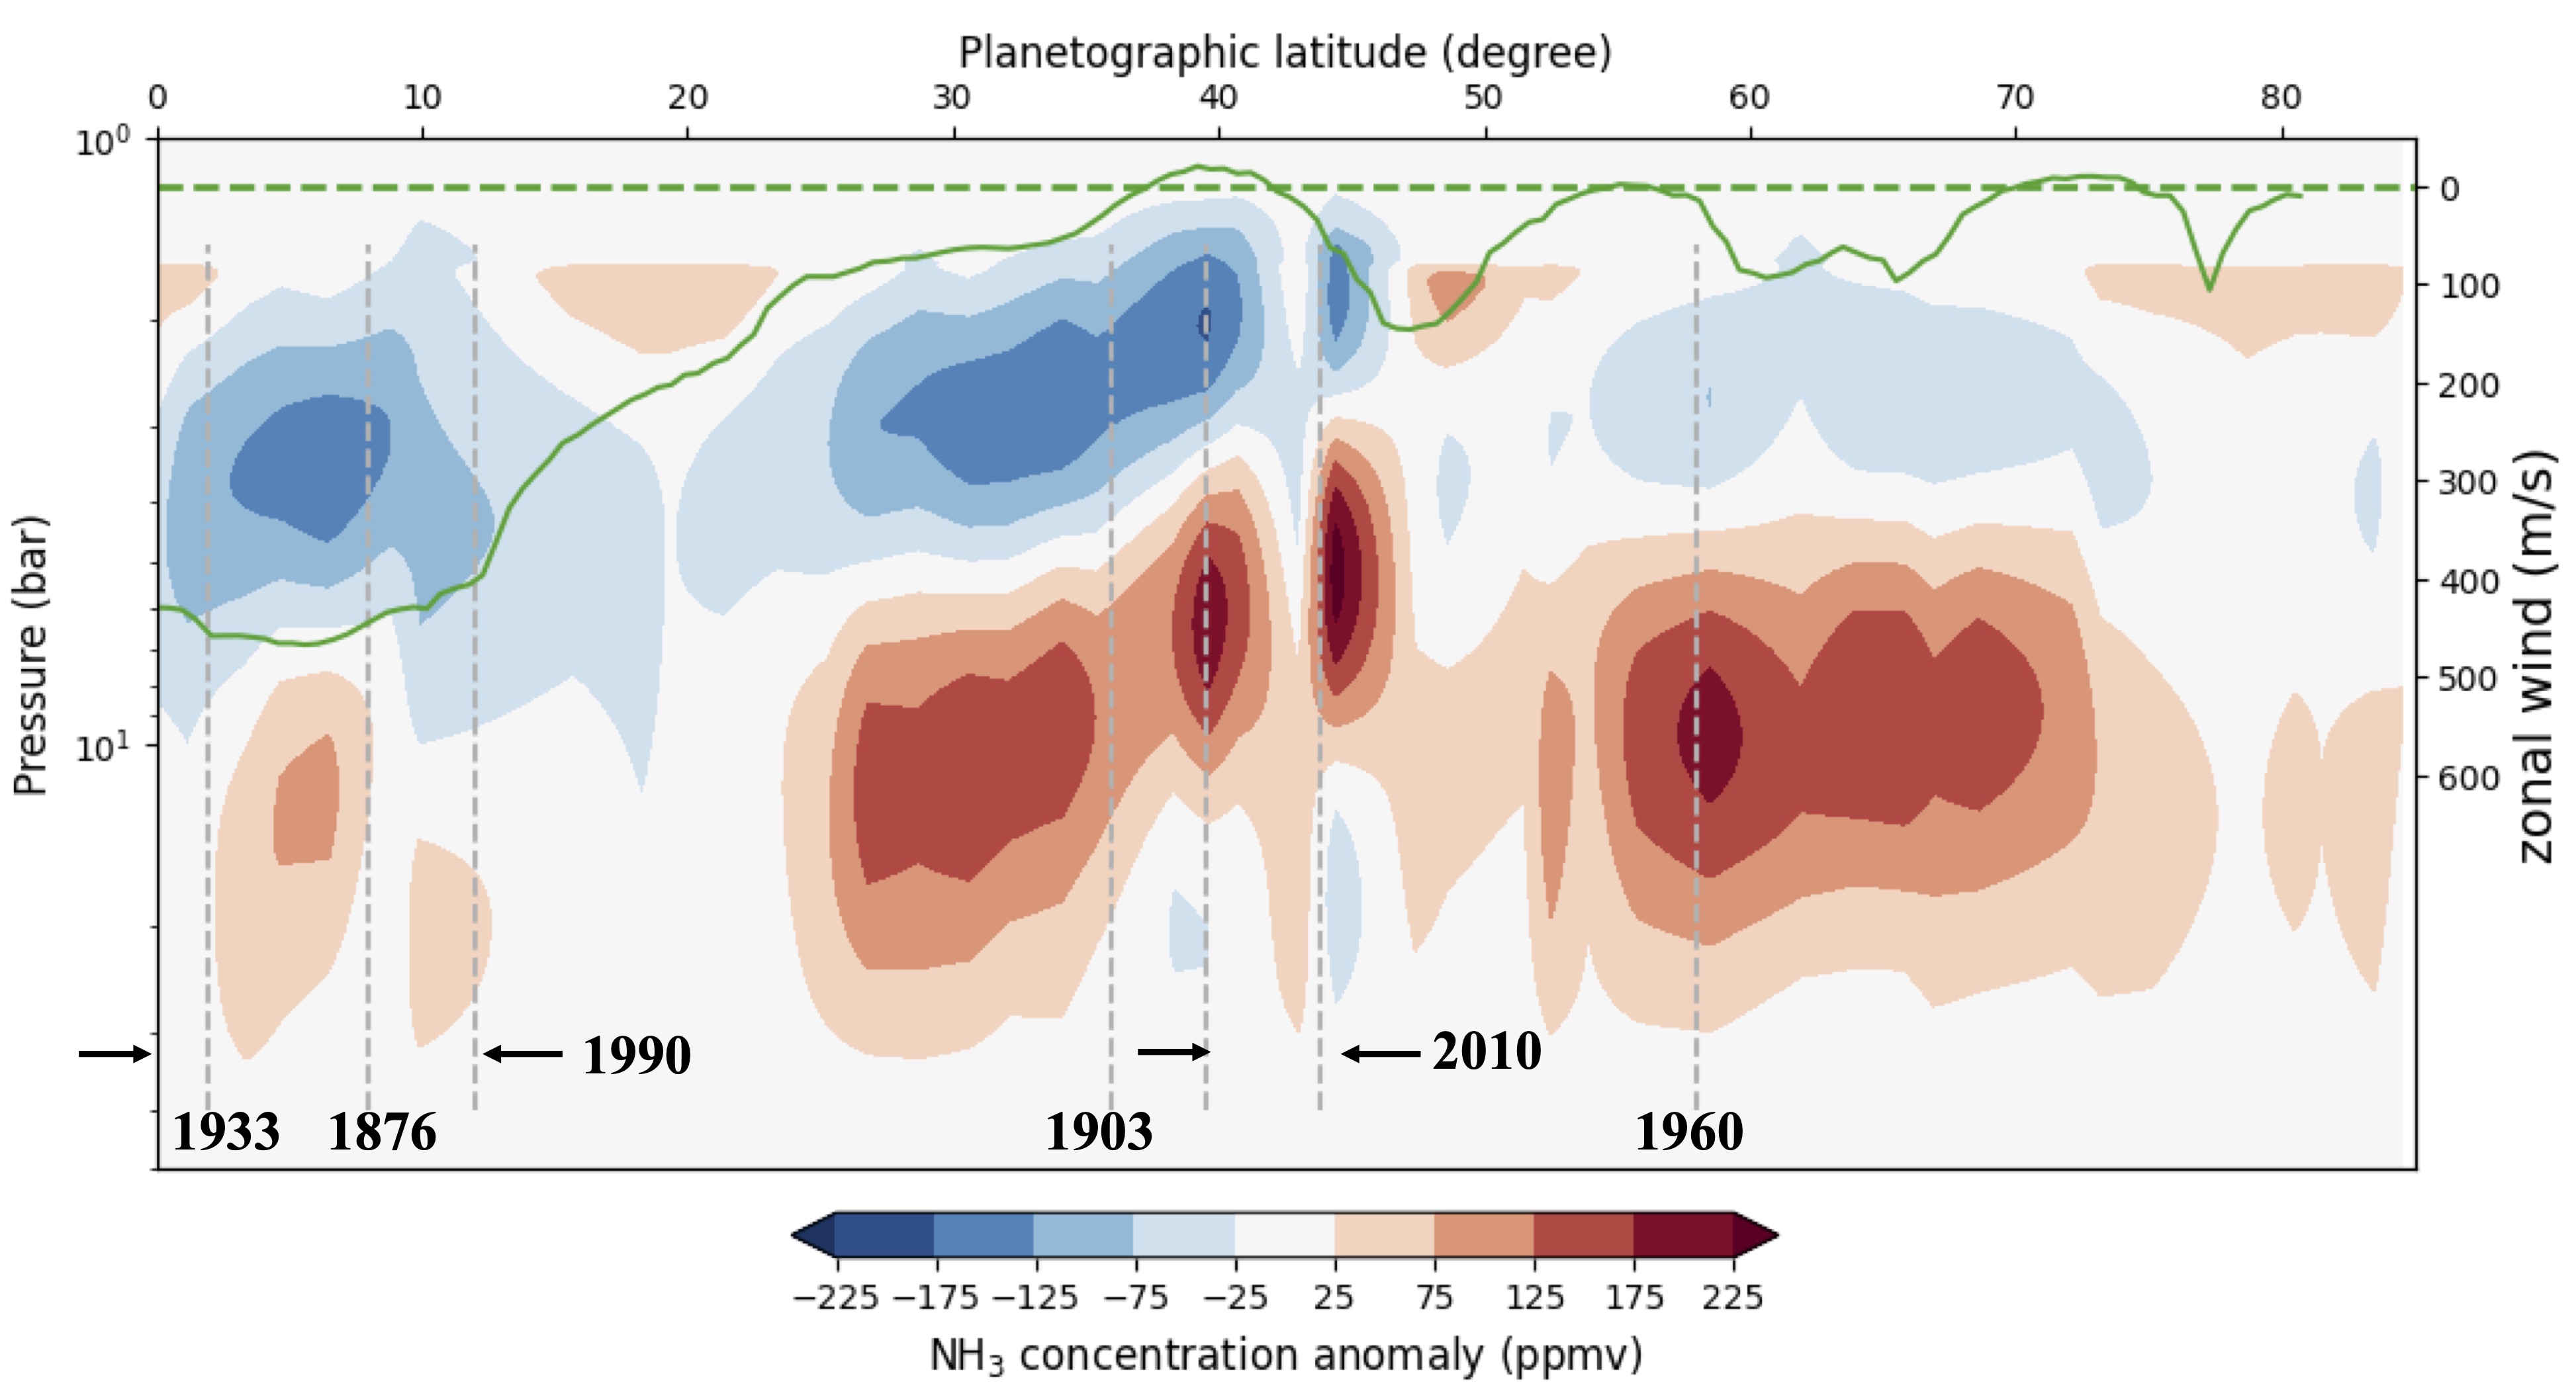
Ammonia vapor concentration anomaly with respect to a homogeneous model. The zonal wind profile is indicated by the green curve at the top, with its scale along the right y-axis. The locations and the years of the previous giant storms are annotated in the figure. Storms in 1876, 1933, 1903, and 1960 are denoted by their center locations. The equatorial storms (1876,1933,1990) and the 2010 storm are displayed as a latitude range. From: Li, Cheng, de Pater, Imke, Moeckel, C.M., Sault, R.J., Butler, B., deBoer, D., Zhang, Z., 2023. Long-lasting, deep effect of Saturn's Giant Storms. Science Advances, . DOI:10.1126/sciadv.adg9419
>>See UC Berkeley's Press Release 2023/08/11<<
>>See University of Michigan's Press Release 2023/08/14<<