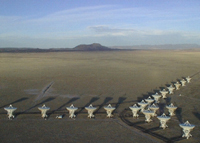

Karl G. Jansky Very Large Array (VLA)
Plains of San Augustin, west of Socorro, New Mexico
Atacama
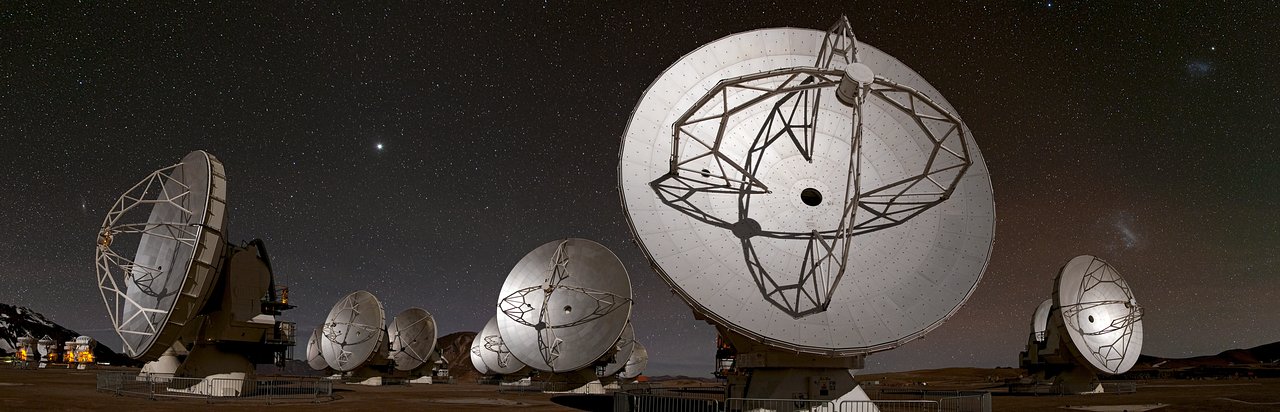
Millimeter/submillimeter Array (ALMA)
Atacama Desert, Chile
Atacama Desert, Chile
|
|
|
|
|
Karl G. Jansky Very Large Array (VLA) Plains of San Augustin, west of Socorro, New Mexico |
Atacama
Millimeter/submillimeter Array (ALMA)
Atacama Desert, Chile |
VLA RADIO MAPS OF JUPITER AT HIGH SPATIAL RESOLUTION
Radio wavelengths can probe altitudes in Jupiter's atmosphere below its visible cloud layers. We used the Very Large Array to map this unexplored region down to ~8 bar, ~100 km below the visible clouds. Our maps reveal a dynamically very active planet at pressures < 2-3 bar, plus a radio-hot belt that consists of relatively transparent regions (a low ammonia concentration, NH3 being the dominant source of opacity) probing depths to over ~8 bar; these likely coincide with 5-micron hotspots. This radio-hot belt is at the interface of the North Equatorial Belt (NEB) and Equatorial Zone (EZ), on the north flank of the eastward jet at 7.8 deg. N. Just to the south of this radio-hot belt we distinguish an equatorial wave, bringing up ammonia gas from Jupiter's deep atmosphere. This wave has been theorized to underlie the 5-micron hot spots, although the predicted counterpart of such hot spots, as seen in our radio maps, had not been observed before. This work has been published: de Pater, I., R.J. Sault, Bryan Butler, David DeBoer, Michael H. Wong, 2016. Peering through Jupiter's Clouds with Radio Spectral Imaging, Science, 352, Issue 6290, pp. 1198-1201. A paper presenting the full dataset has been published in Icarus, 322, 168-191 (2019). Some figures are shown below.
A radio image of Jupiter from the VLA at three wavelengths: 2 cm in blue, 3 cm in gold, and 6 cm in red (click to enlarge image). A uniform disk has been subtracted to better show the fine banded structure on the planet. The pink glow surrounding the planet is synchrotron radiation produced by spiraling electrons trapped in Jupiter's magnetic field. Banded details on the planet's disk probe depths of 30-90 km below the clouds. This image is averaged from 10 hours of VLA data, so any longitudinal structure is smeared by the planet's rotation. (CREDITS: Imke de Pater, Michael H. Wong (UC Berkeley), Robert J. Sault (Univ. Melbourne))
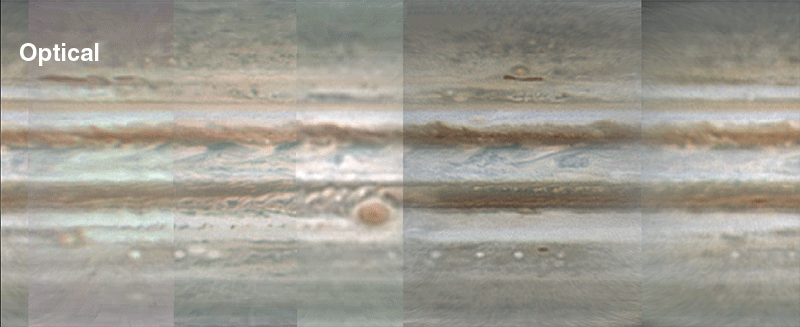
In this movie and/or animated gif, optical images of the surface clouds encircling Jupiter's equator -including the famous Great Red Spot- alternate with a new detailed radio image of the deep atmosphere (up to 30 kilometers below the clouds). The radio map shows ammonia-rich gases rising to the surface (dark) intermixed with descending, ammonia-poor gases (bright). In the cold temperatures of the upper atmosphere (160 to 200 Kelvin, or -170 to -100 degrees Fahrenheit), the rising ammonia condenses into clouds, which are invisible in the radio region. (CREDITS Radio: Robert J. Sault (Univ. Melbourne), Imke de Pater and Michael H. Wong (UC Berkeley). Optical: Marco Vedovato constructed groundbased optical Jupiter maps (from images taken by Christopher Go, Tadashi Horiuchi, Michel Jacquesson, Manos Kardasis, John Rozakis, Ian Sharp, Joost Verheyden, and Sean Walker) using Grischa Hahn's WinJupos software, available from http://jupos.org. The geometry of the optical image was adapted to match the radio map by Imke de Pater. Reference: de Pater et al., 2016; Science, 352, Issue 6290, pp. 1198-1201.
>>An mp4 movie of the above can be downloaded here<<
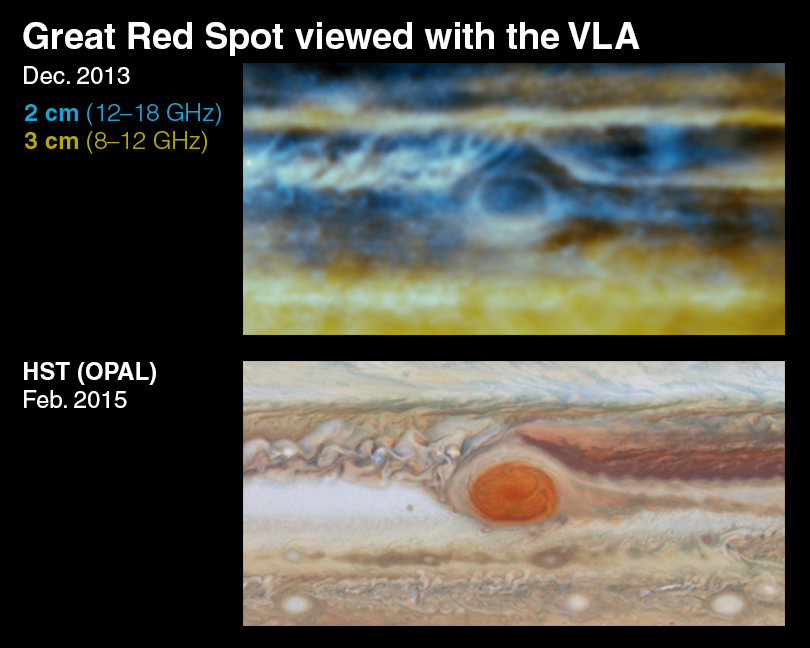
The VLA radio map of the region around the Great Red Spot in Jupiter's atmosphere shows complex upwellings and downwellings of ammonia gas (upper map), that shape the colorful cloud layers seen in the approximately true-color Hubble map (lower map). Two radio wavelengths are shown in blue (2 cm) and gold (3 cm), probing depths of 30-90 kilometers below the clouds. (CREDITS Radio: Michael H. Wong, Imke de Pater (UC Berkeley), Robert J. Sault (Univ. Melbourne). Optical: NASA, ESA, A.A. Simon (GSFC), M.H. Wong (UC Berkeley), and G.S. Orton (JPL-Caltech)).
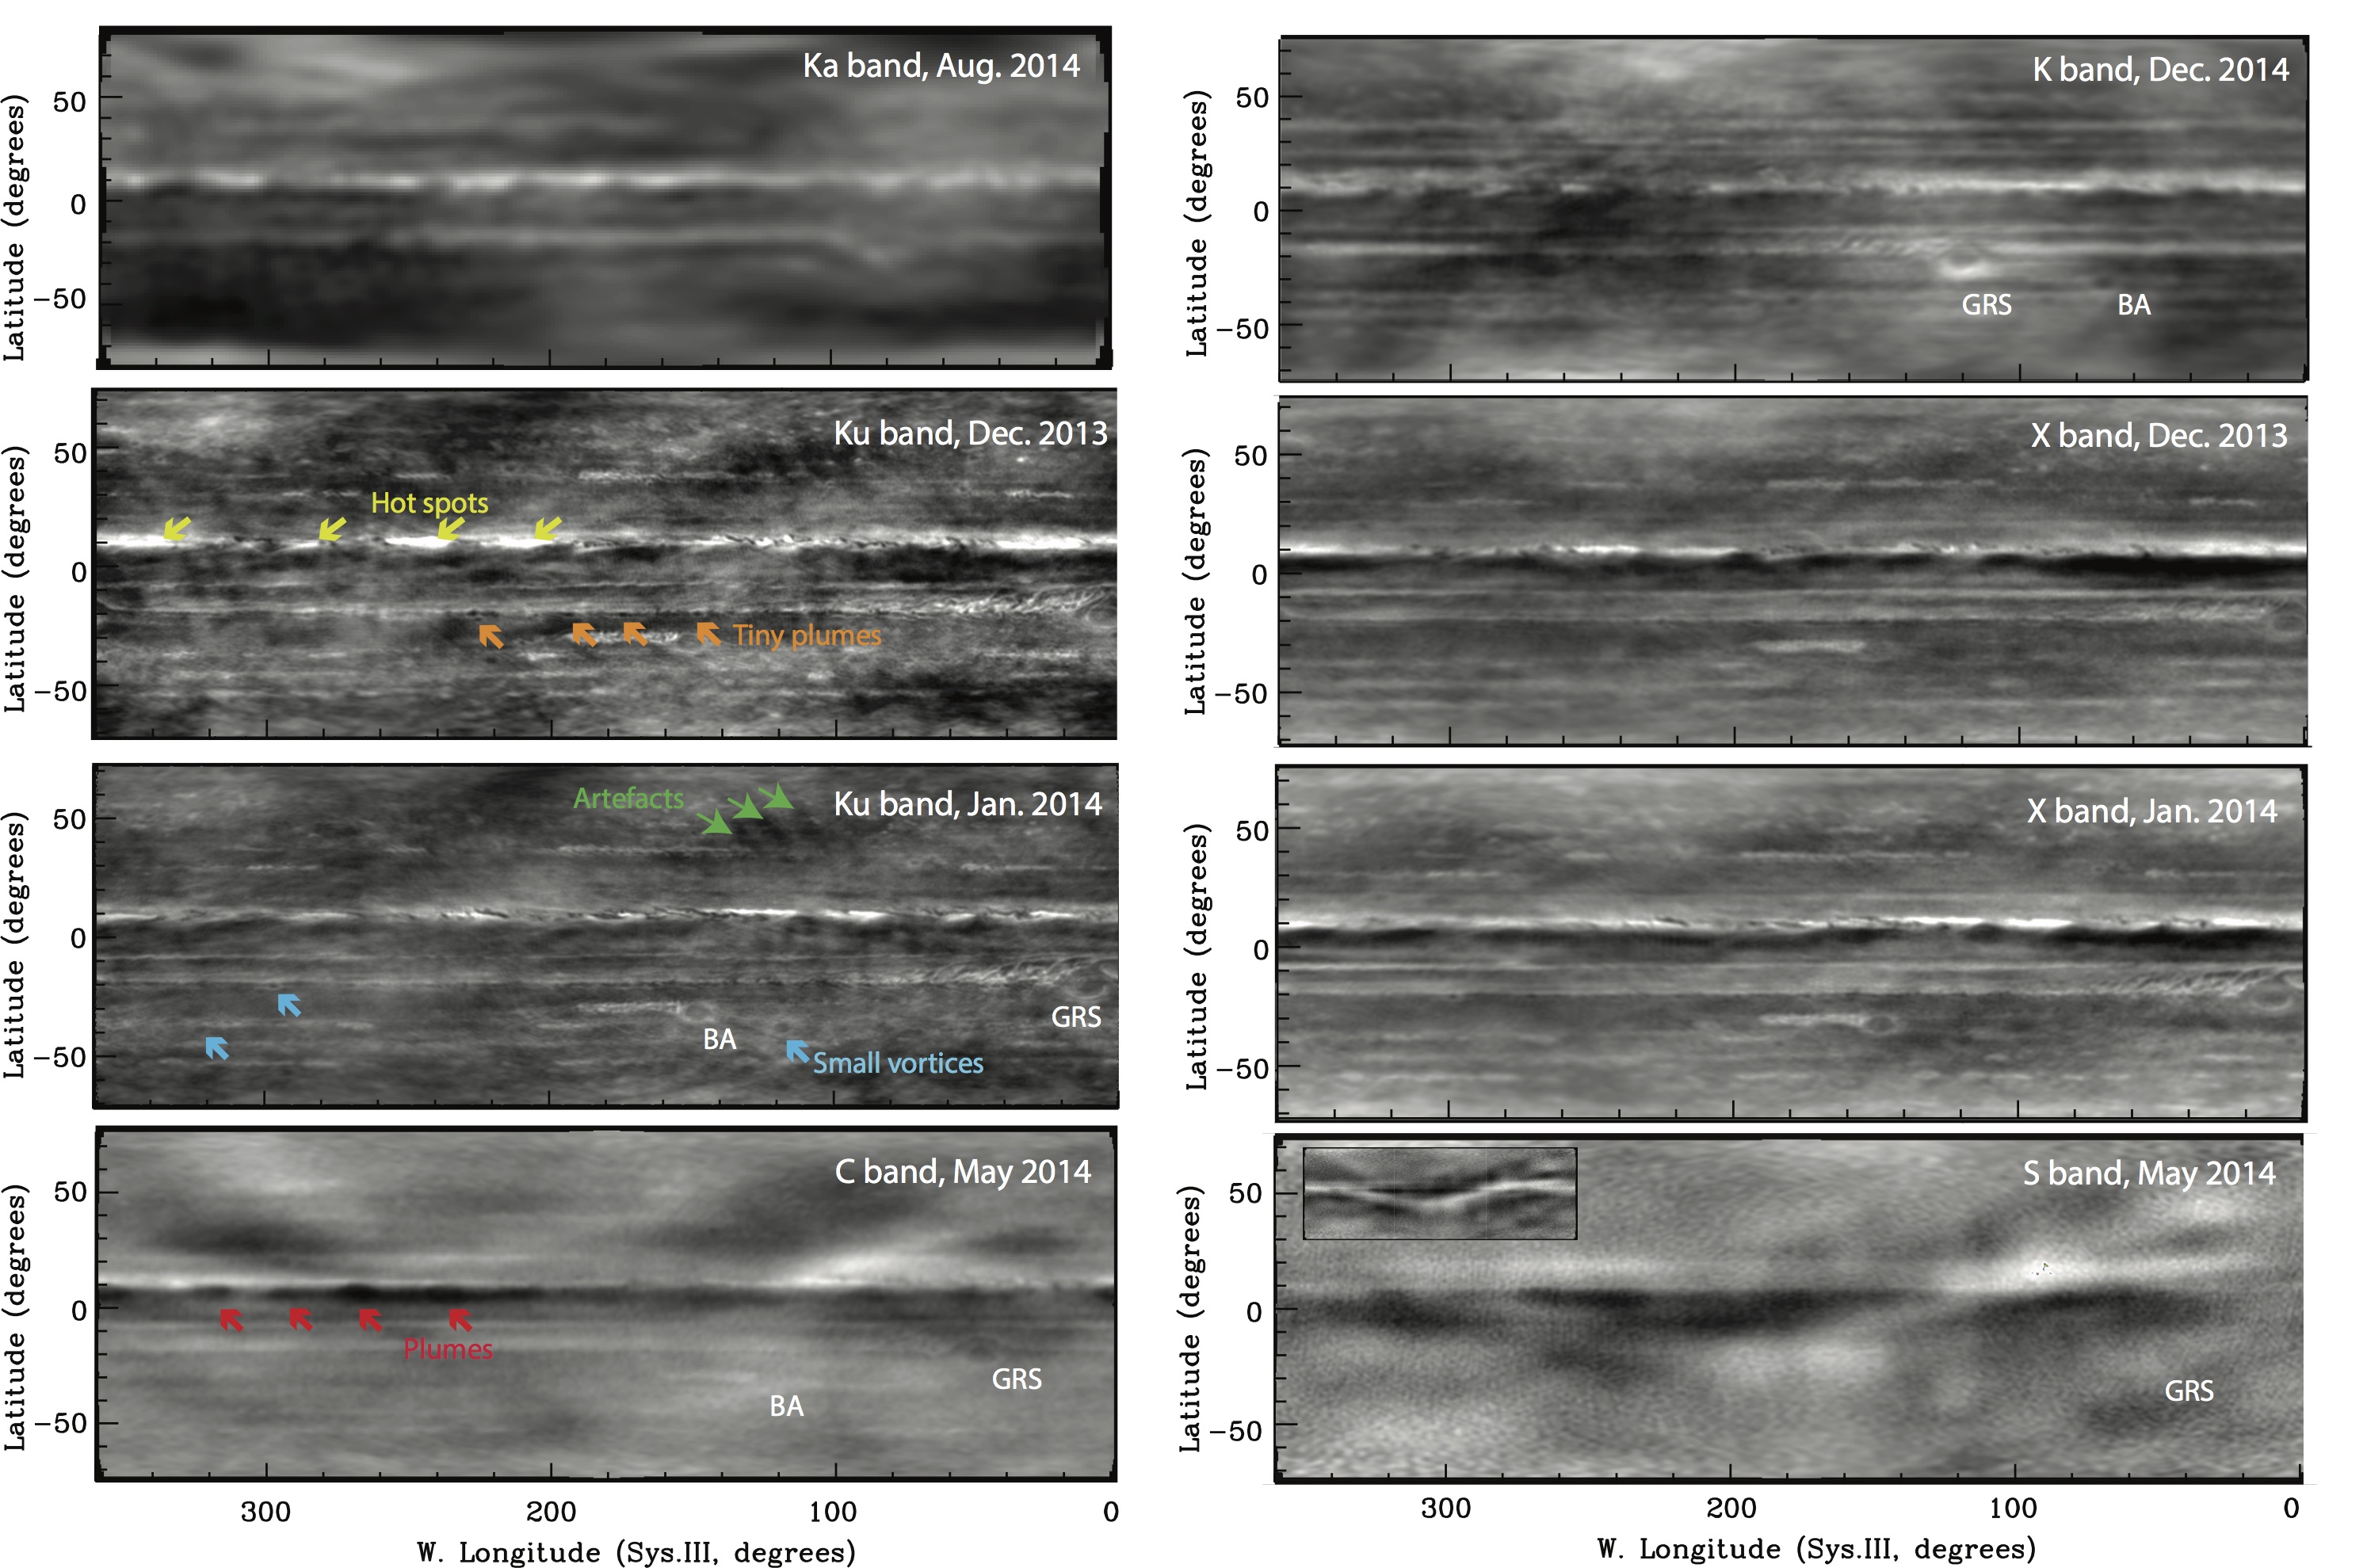
Left: Longitude-resolved maps at Ka (29-37 GHz), Ku 12-18 GHz), and C (4-8 GHz) bands, as indicated in the upper right hand corners. A few features are indicated: green arrows: large-scale artefacts; yellow: hot spots; red: ammonia plumes; orange: tiny plumes; cyan: small vortices. Right: Longitude-resolved maps at K (18-26 GHz), X (8-12 GHz), and S (2-4 GHz) bands. (Fig. 8 from de Pater et al., 2019). (Credits: Imke de Pater, R.J. Sault, and NRAO/the Very Large Array).
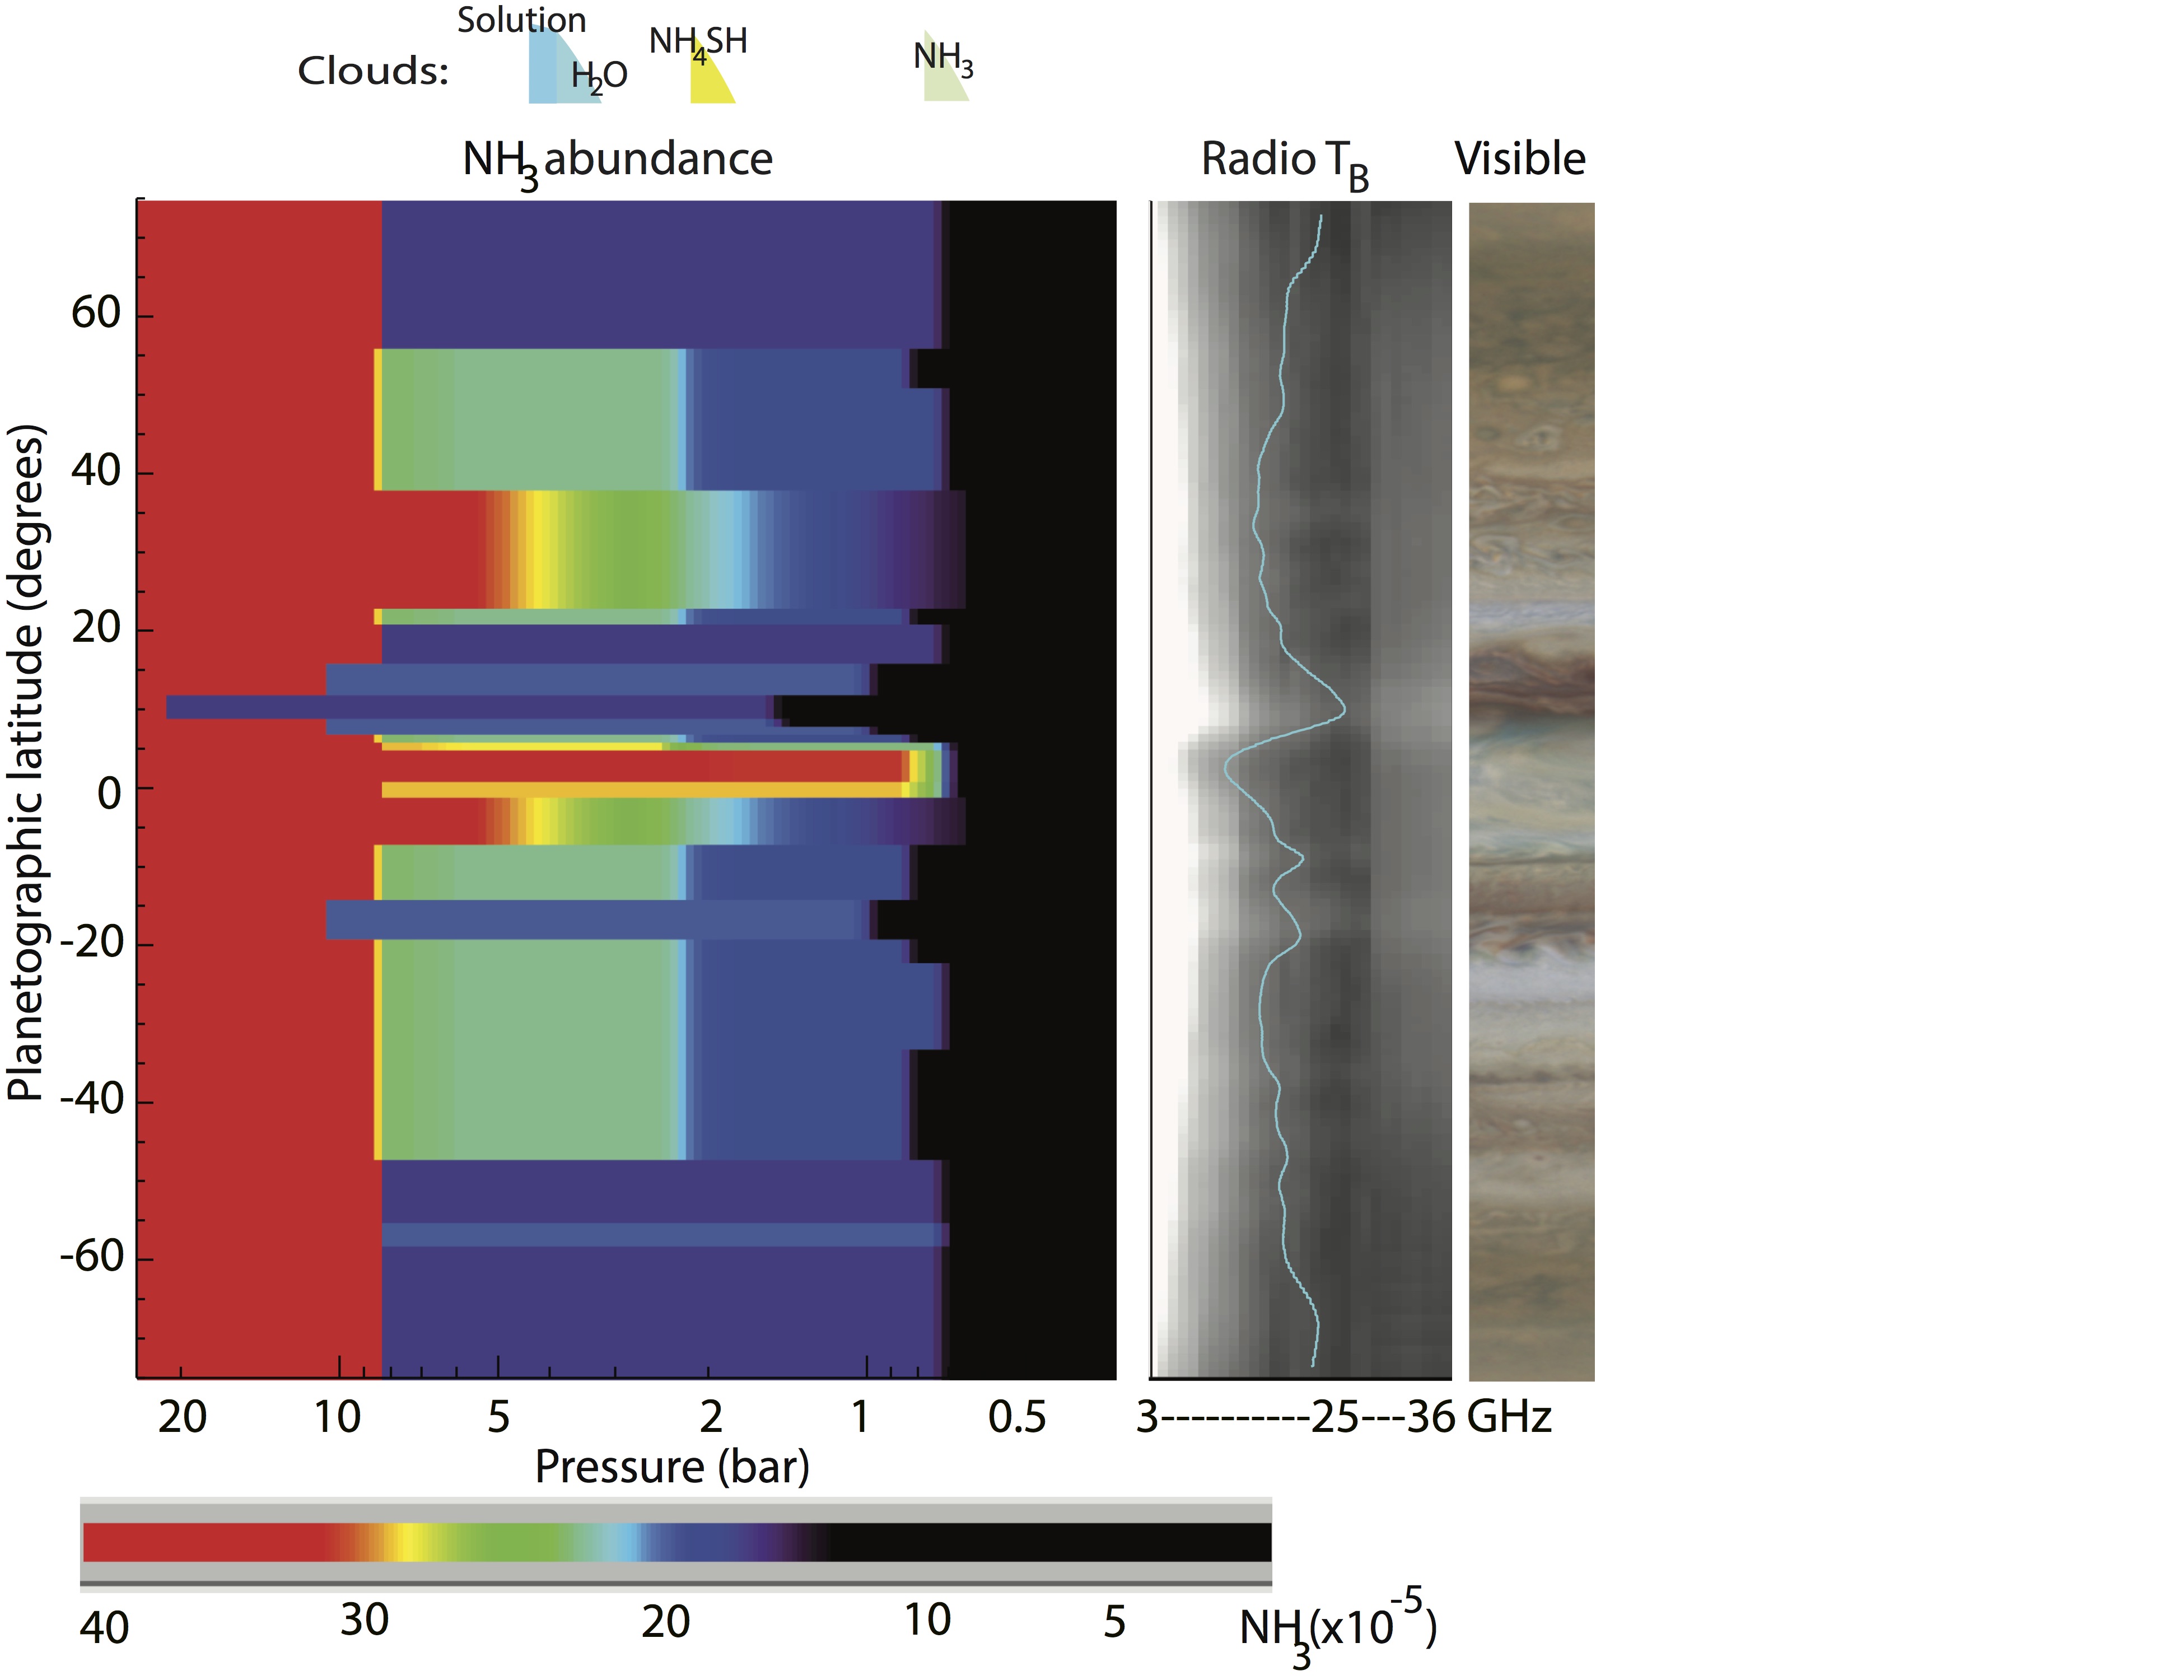
Ammonia abundance as obtained by tting the VLA data is shown on the left, with a scalebar at the bottom. The approximate location of the various cloud layers is shown at the top. The image in the middle shows the radio brightness temperature map, with superposed the 10GHz brightness temperature scan. On the right a slice through Jan. 2015 OPAL data (from Simon et al., 2015) is shown. This ammonia profile also gives a perfect fit to data from the Mircowave Radiometer on NASA's Juno mission. (see de Pater et al., 2019, for details). (Credit: Imke de Pater and UC Berkeley)
>>See UCB Press Release 2016/06/03<<