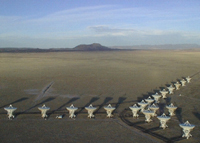

Karl G. Jansky Very Large Array (VLA)
Plains of San Augustin, west of Socorro, New Mexico
Atacama
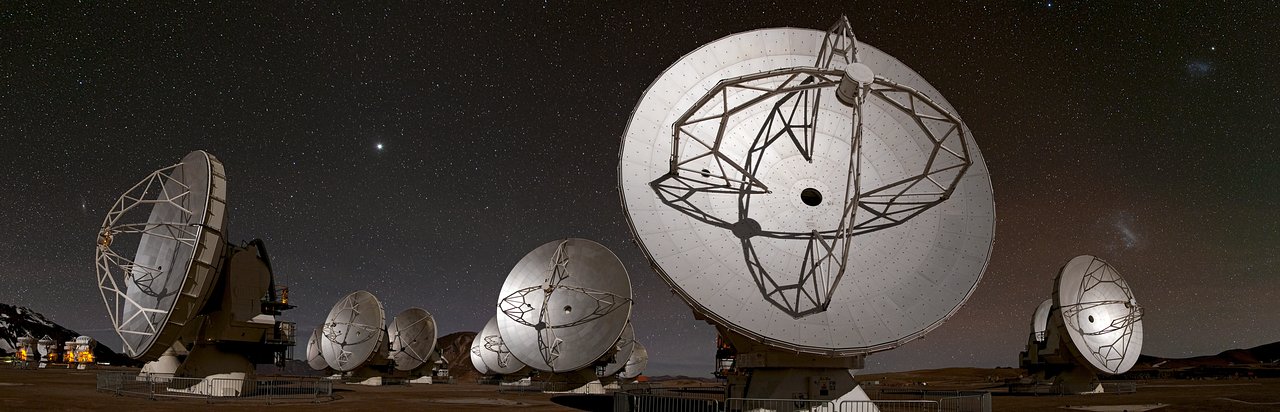
Millimeter/submillimeter Array (ALMA)
Atacama Desert, Chile
Atacama Desert, Chile
|
|
|
|
|
Karl G. Jansky Very Large Array (VLA) Plains of San Augustin, west of Socorro, New Mexico |
Atacama
Millimeter/submillimeter Array (ALMA)
Atacama Desert, Chile |
RADIO IMAGES OF URANUS
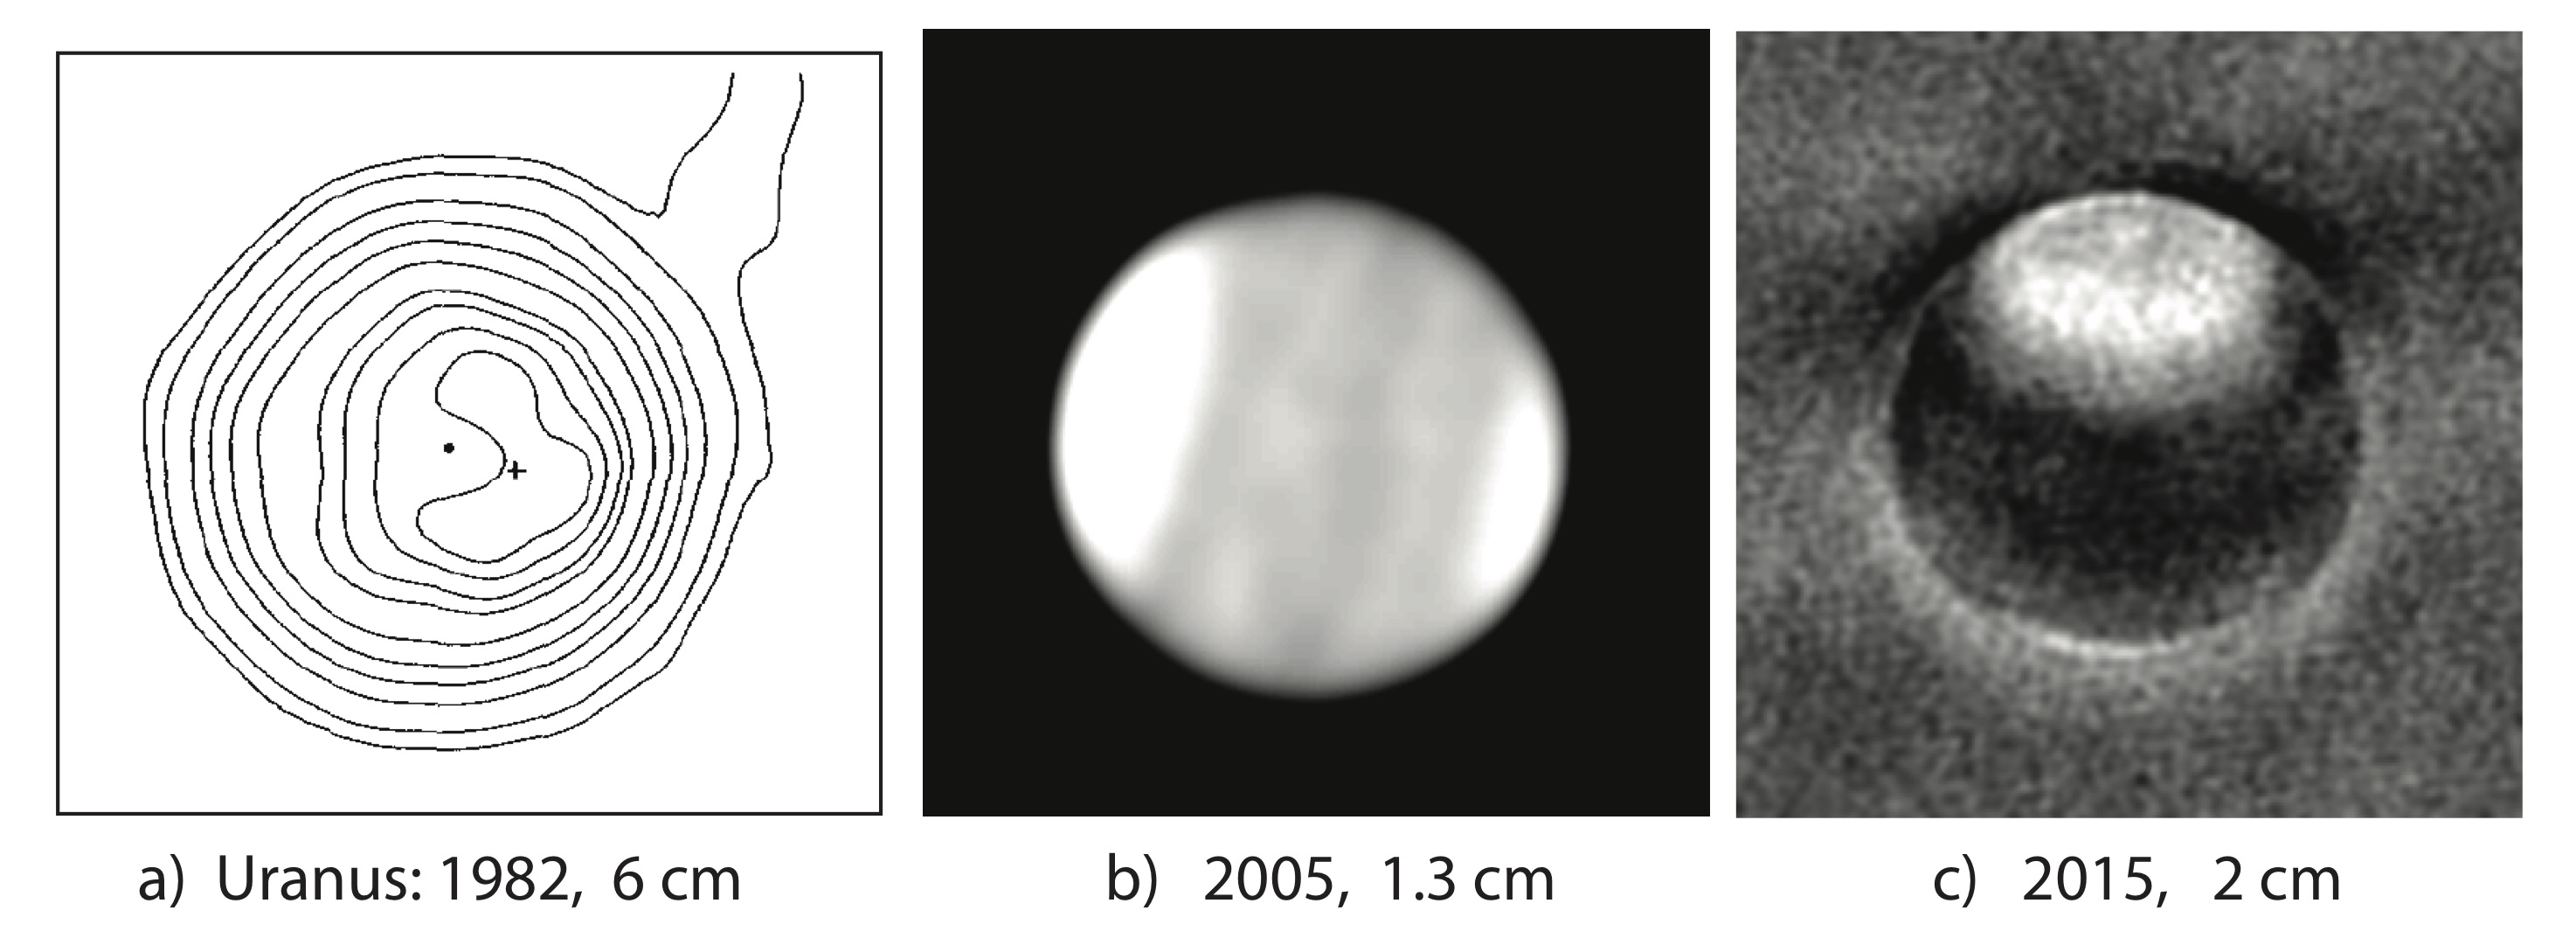
Radio observations of Uranus obtained between the early 60's and 80's revealed a steady increase in its disk-averaged brightness temperature, which was attributed to the poles potentially being warmer than its equator, a hypothesis confirmed using the imaging capabilities of the VLA (e.g., de Pater & Gulkis (1988)); several images are shown below, which clearly show that both poles are much brighter than the equator. Both the 2005 and 2015 images show several broad bands on Uranus. Uranus pole has an intriguing structure as well, though not dissimilar to that seen at other poles: a bright polar dot, surrounded by a slightly darker (cooler) region, encircled by a bright ring, like the polar collar seen at infrared wavelengths.
Radio images of Uranus taken at in different years and at different wavelengths: 1982 at 6 cm, when the south pole (indicated by a +) was near the subsolar point (the dot) (de Pater & Gulkis 1988). b) 2005 at a wavelength of 1.3 cm, (Hofstadter & Butler). c) 2015, a preliminary image at 2 cm (de Pater & Sault). In all images the planet is roughly 3.5-4" across. All maps were constructed from many hours of data, so longitudinal features are smeared by the planet's rotation. The bright regions near the poles imply a relative lack of absorbing gases (H2S, NH3) above both poles. (from: de Pater, I., B. butler, R. J. Sault, A. Moullet, C. Moeckel, J. Tollefson, K. de Kleer, M. Gurwell, S. Milam, 2018. Potential for Solar System Science with the ngVLA. ASP Monograph Series: Science with a Next-Generation VLA, ed. E. J. Murphy (ASP, San Francisco, CA). pp. 49-72. eprint arXiv:1810.08521)
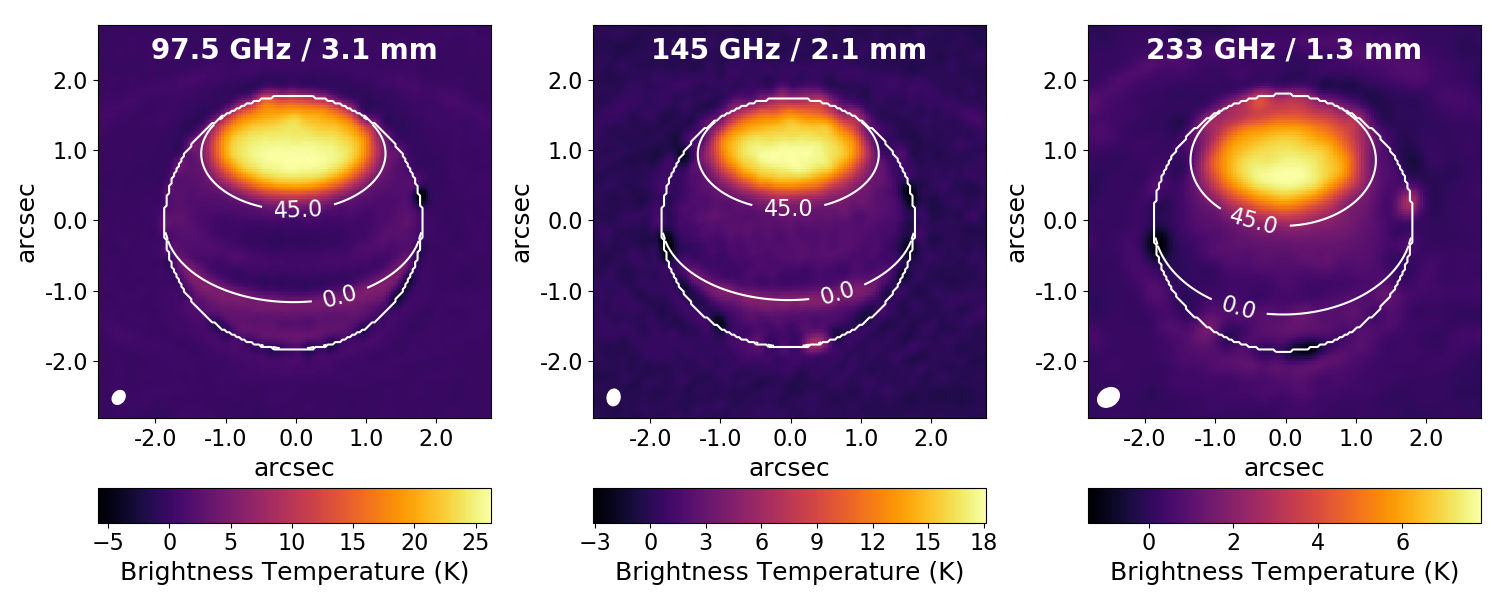
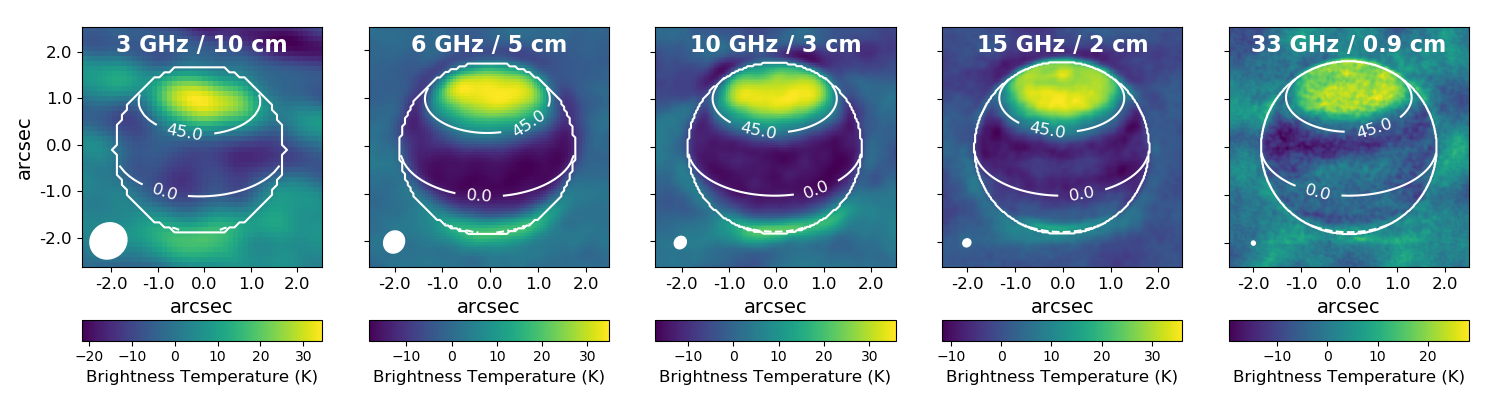
Images of Uranus constructed from data obtained with ALMA (top) and the (upgraded) VLA (bottom) spanning wavelengths from 1 mm to 20 cm. The color bars below each image indicate the brightness temperature residuals in Kelvin, after subtraction of a uniform limbdarkened disk. The synthesized beam is shown as a white ellipse in the bottom left corner of each image. From: Molter, E.M., de Pater, I., Luszcz-Cook, S., Tollefson, J., Sault, R.J., Butler, B., de Boer, D.,: Tropospheric Composition and Circulation of Uranus with ALMA and the VLA. 2021, 2, 3, doi:10.3847/PSJ/abc48a.